
- If you are wondering whether CarMax is finally priced like a bargain after its brutal slide, or if it is cheap for a reason, this article is for you.
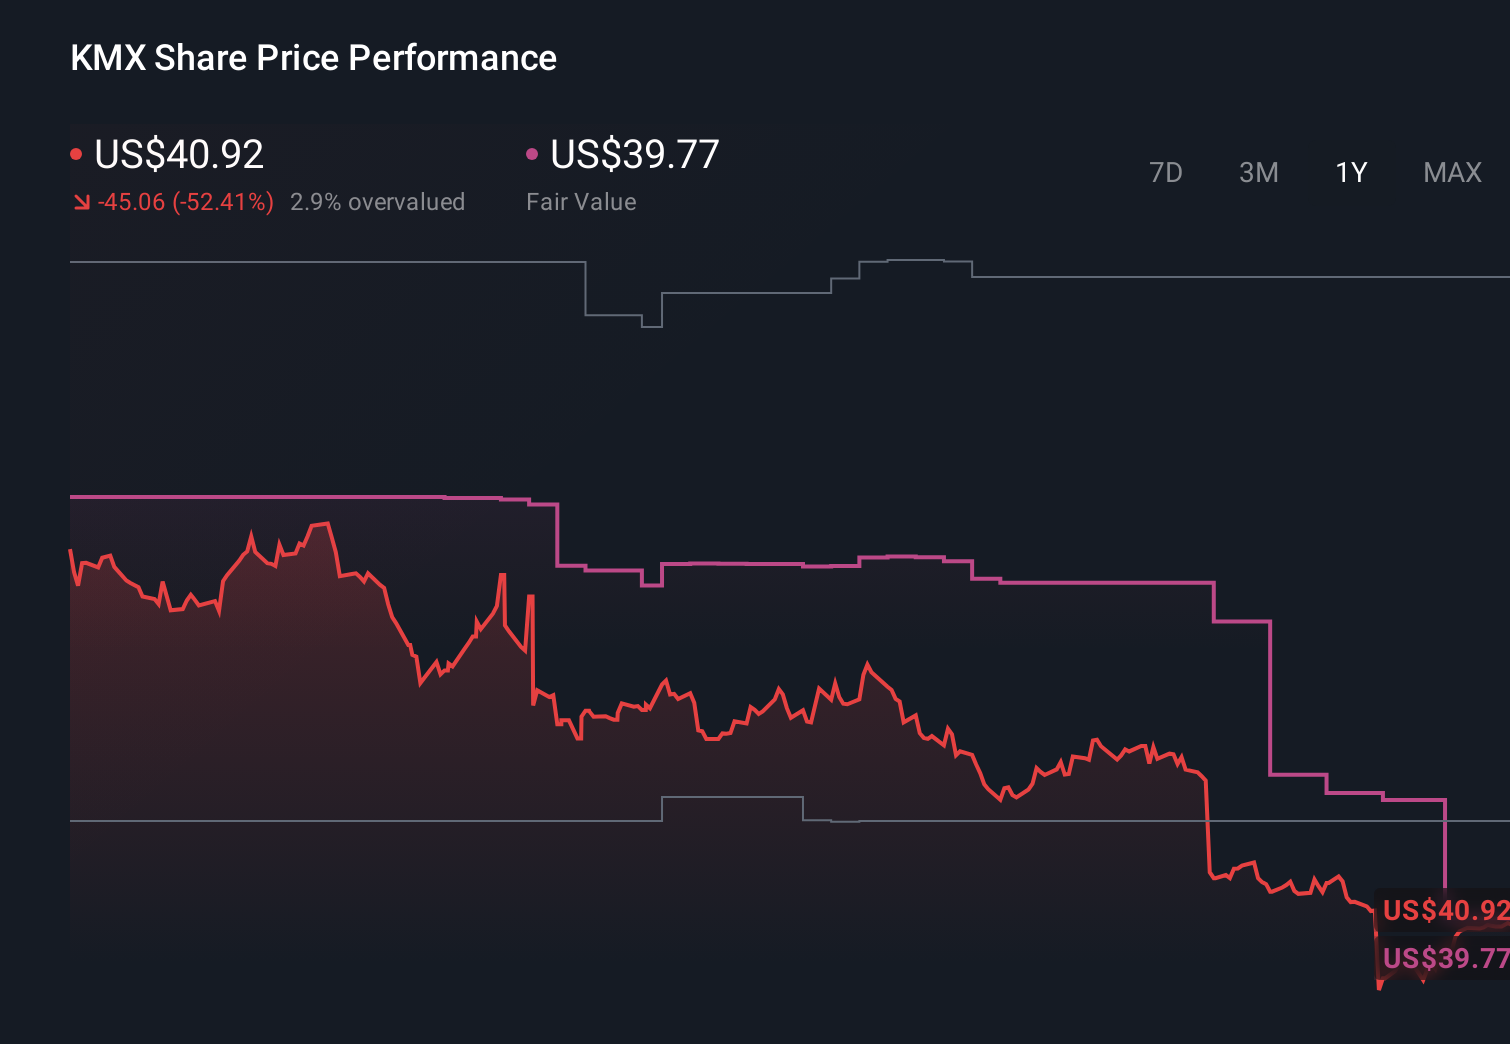
- The stock has bounced 5.6% over the last week and 23.9% over the past month, but it is still down 49.3% year to date and 52.6% over the last year, a classic setup that attracts value hunters and risk takers alike.
- Recent headlines have focused on a tougher used car demand backdrop and shifting consumer sentiment, alongside ongoing questions around financing costs and affordability in the auto market. Together, these themes help explain why the market has repriced CarMax so aggressively while still allowing for sharp short term rallies when sentiment improves.
- On our valuation framework, CarMax earns a 4/6 value score. This suggests it screens as undervalued on most, but not all, checks. We will break down what different valuation methods are really saying about the stock, and then circle back to an even more practical way to think about CarMax's true value by the end of this piece.
Find out why CarMax's -52.6% return over the last year is lagging behind its peers.
Approach 1: CarMax Discounted Cash Flow (DCF) Analysis
A Discounted Cash Flow model estimates what a company is worth by projecting its future cash flows and then discounting them back to today, so everything is expressed in present dollar terms.
For CarMax, the latest twelve month Free Cash Flow is about $733 Million. Analysts and internal estimates project cash flows over the next decade, rising to around $641 Million by 2035. Near term forecasts out to 2028 are based on analyst expectations, while later years are extrapolated by Simply Wall St using the 2 Stage Free Cash Flow to Equity approach.
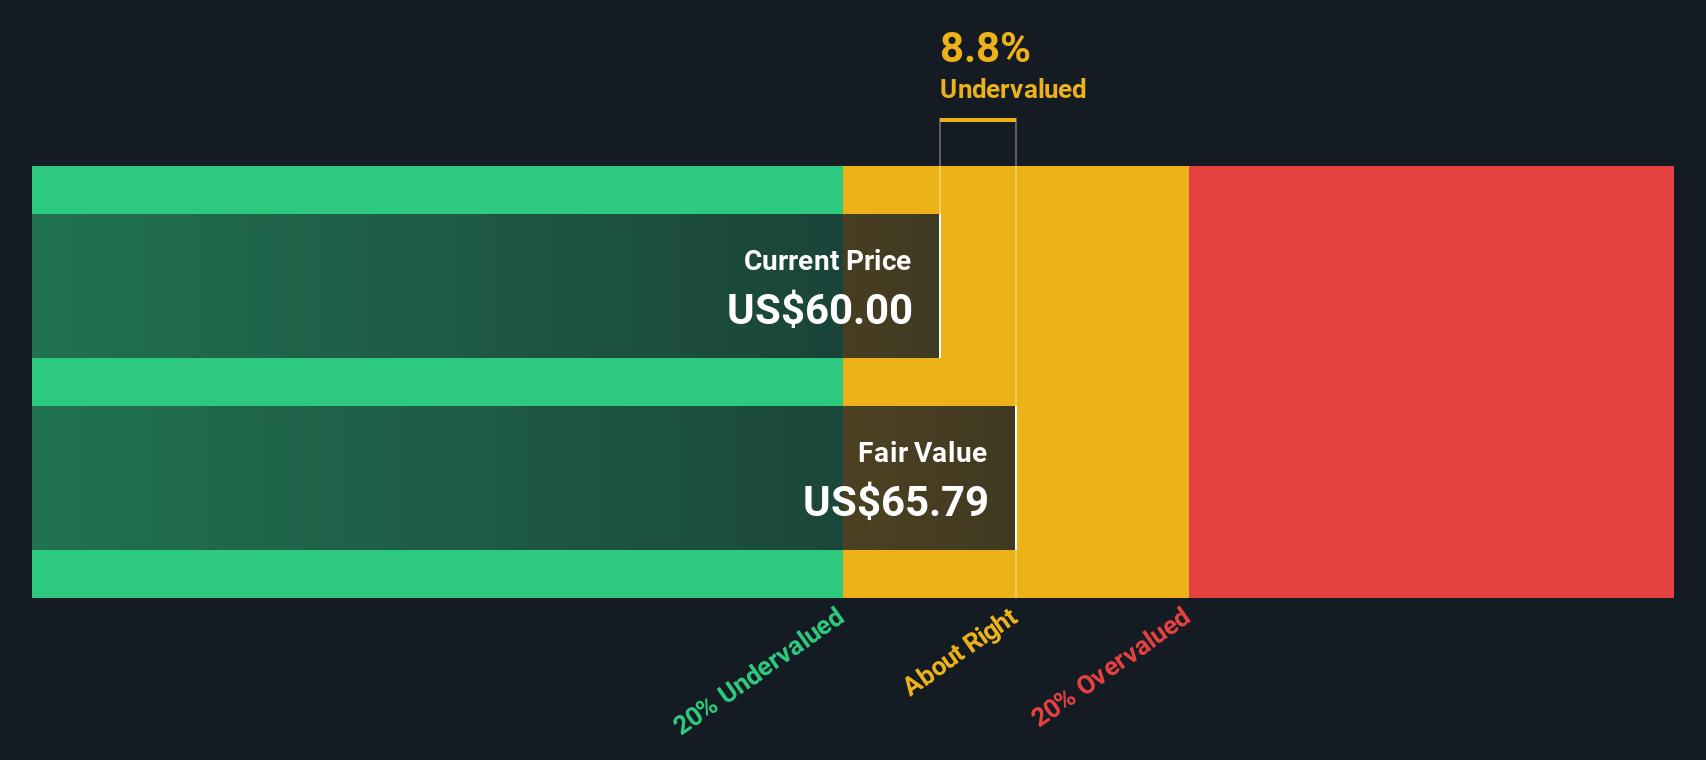
When all those projected cash flows are discounted back, the model arrives at an intrinsic value of about $44.15 per share. That implies CarMax trades at roughly a 6.7% discount to this DCF estimate. This suggests the market price and the model value are reasonably close, with a modest edge for long term buyers.
Result: ABOUT RIGHT
CarMax is fairly valued according to our Discounted Cash Flow (DCF), but this can change at a moment's notice. Track the value in your watchlist or portfolio and be alerted on when to act.
Approach 2: CarMax Price vs Earnings
For a profitable business like CarMax, the price to earnings ratio is a straightforward way to judge value, because it ties the share price directly to the profits each share is generating today.
In general, higher growth and lower risk justify a higher PE, while slower, more volatile or cyclical earnings usually deserve a lower multiple. Investors are effectively deciding how many years of current earnings they are willing to pay for, based on how confident they are those earnings will grow and persist.
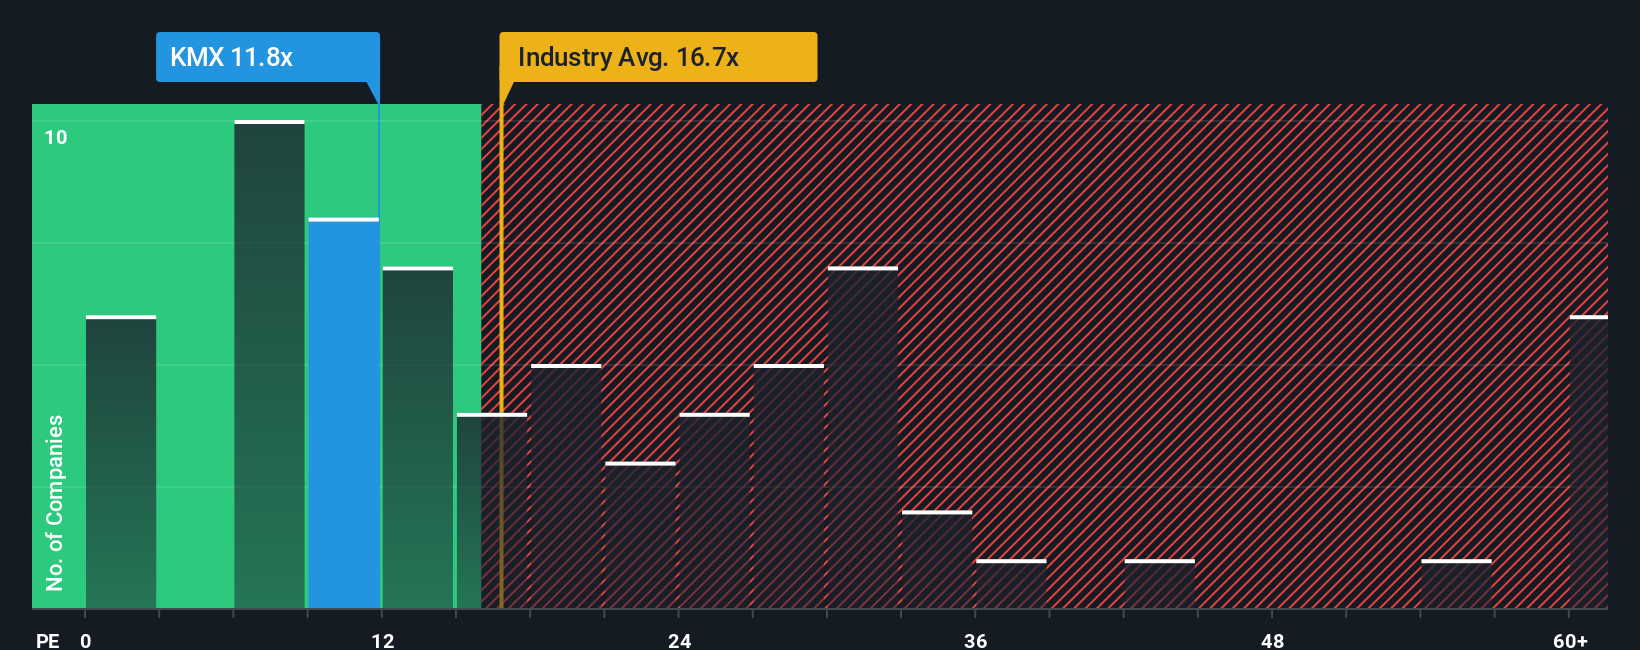
CarMax currently trades at about 11.61x earnings, below both the 19.75x average for the Specialty Retail industry and the 12.51x average of its peer group. Simply Wall St also calculates a Fair Ratio of 17.64x for CarMax, a proprietary estimate of what its PE should be once you factor in its earnings growth outlook, profitability, risk profile, industry and market cap. This Fair Ratio is more tailored than a simple peer or industry comparison because it adjusts for CarMax’s specific fundamentals rather than assuming all retailers deserve the same multiple. With the shares at 11.61x versus a Fair Ratio of 17.64x, the stock screens as meaningfully undervalued on an earnings basis.
Result: UNDERVALUED
PE ratios tell one story, but what if the real opportunity lies elsewhere? Discover 1446 companies where insiders are betting big on explosive growth.
Upgrade Your Decision Making: Choose your CarMax Narrative
Earlier we mentioned that there is an even better way to understand valuation. Let us introduce you to Narratives, a simple way to put your own story about a company alongside the numbers by linking what you believe about its future revenue, earnings and margins to a financial forecast and ultimately a fair value estimate on Simply Wall St’s Community page, where millions of investors share perspectives. For CarMax, for example, a more optimistic Narrative might assume digital expansion, credit normalization and margin recovery that supports a fair value closer to the high analyst target around 120 dollars. A more cautious Narrative might instead emphasize ongoing credit risks, weaker unit trends and competitive pressure that justify a fair value nearer the low target around 40 dollars. As new information such as earnings, news or strategic updates comes in, these Narratives are updated dynamically, allowing you to compare your evolving fair value to today’s share price and decide when it makes sense for you to buy, hold or sell based on the story you believe is most likely.
Do you think there's more to the story for CarMax? Head over to our Community to see what others are saying!
This article by Simply Wall St is general in nature. We provide commentary based on historical data and analyst forecasts only using an unbiased methodology and our articles are not intended to be financial advice. It does not constitute a recommendation to buy or sell any stock, and does not take account of your objectives, or your financial situation. We aim to bring you long-term focused analysis driven by fundamental data. Note that our analysis may not factor in the latest price-sensitive company announcements or qualitative material. Simply Wall St has no position in any stocks mentioned.
Have feedback on this article? Concerned about the content? Get in touch with us directly. Alternatively, email editorial-team@simplywallst.com