
- If you are wondering whether JD.com is quietly turning into a value opportunity after years of pain, you are not alone. This is exactly the question we are going to unpack.
- Despite a tough run, with the share price down about 1.2% over the last week, 6.6% over the past month, and still roughly 22.8% lower over the last year, the stock is starting to look more interesting to value focused investors.
- Recent headlines have focused on JD.com sharpening its focus on core e commerce, doubling down on logistics efficiency, and leaning into lower price strategies to defend and grow its market share in China. At the same time, investors are weighing ongoing competition from peers and macro concerns about Chinese consumer demand, which helps explain why the stock has struggled even as management leans into these strategic moves.
- On our numbers, JD.com scores a solid 5/6 valuation check score. This suggests it screens as undervalued across most metrics. In the rest of this article we will break that down across different valuation approaches, before finishing with an even more practical way to think about JD.com's fair value in your own portfolio.
Find out why JD.com's -22.8% return over the last year is lagging behind its peers.
Approach 1: JD.com Discounted Cash Flow (DCF) Analysis
A Discounted Cash Flow model estimates what a business is worth today by projecting the cash it could generate in the future and then discounting those cash flows back to a present value. For JD.com, this 2 Stage Free Cash Flow to Equity model uses analyst forecasts for the next few years and then extrapolates further out based on Simply Wall St assumptions.
JD.com has recently reported negative free cash flow of roughly CN¥0.23 billion, but analysts expect a sharp turnaround, with free cash flow projected to rise to about CN¥49.90 billion by 2028. Beyond that, cash flows are gradually stepped down in growth and discounted each year to reflect a more mature phase of the business as competition and market saturation increase.
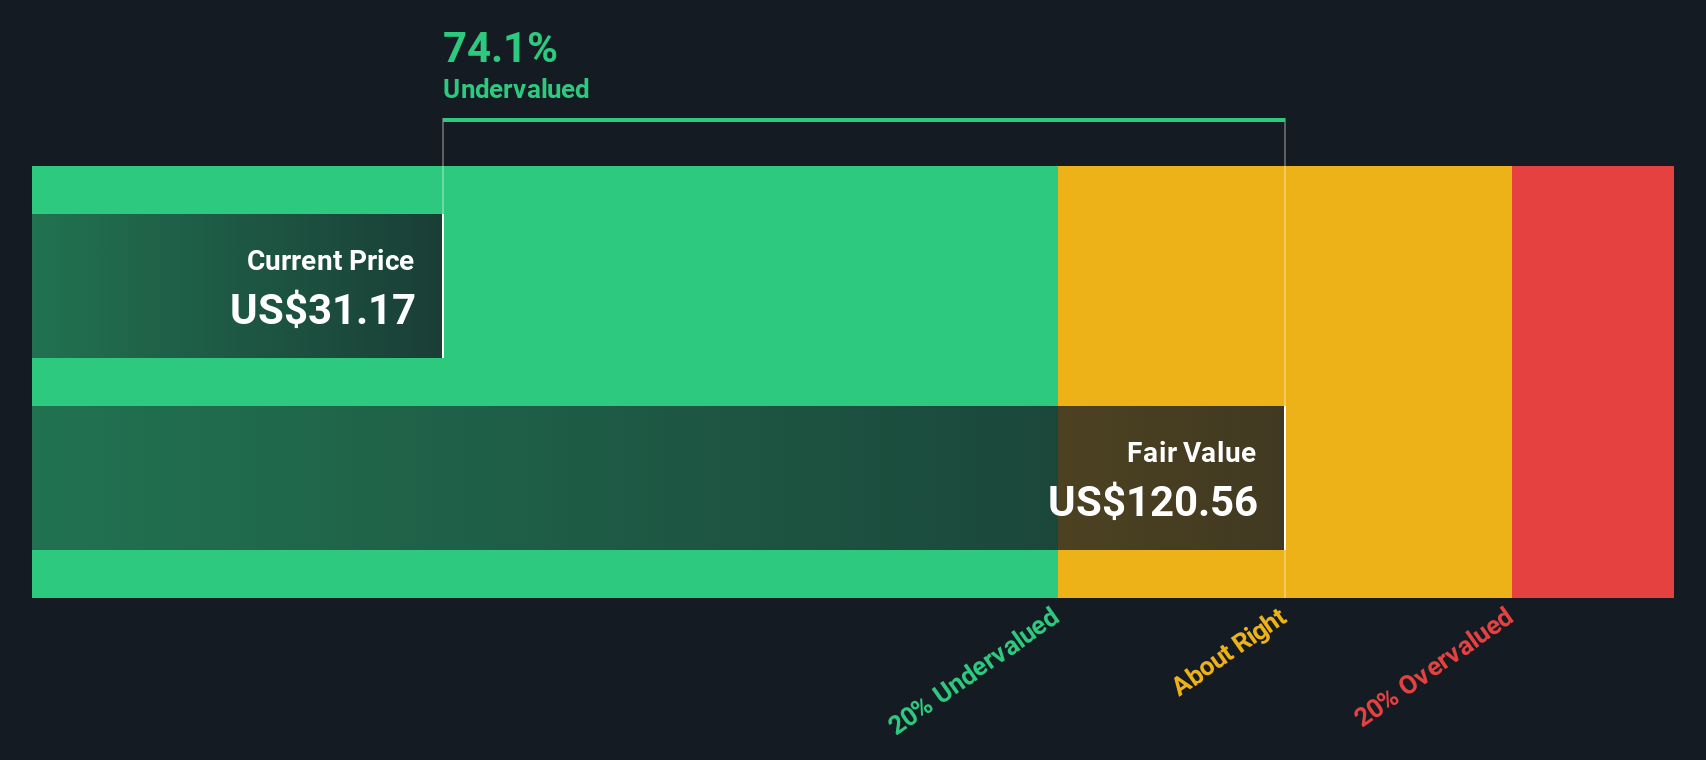
When all these projected cash flows are added up and discounted, the model points to an intrinsic value of about $54.83 per share. That is roughly 45.8% above the current market price. This suggests that investors may be pricing JD.com below its estimated long term cash flow potential under the assumptions used.
Result: UNDERVALUED
Our Discounted Cash Flow (DCF) analysis suggests JD.com is undervalued by 45.8%. Track this in your watchlist or portfolio, or discover 906 more undervalued stocks based on cash flows.
Approach 2: JD.com Price vs Earnings
For a business that is generating consistent profits, the price to earnings (PE) ratio is often the cleanest way to compare what investors are paying for each dollar of earnings. In general, faster growing and lower risk companies justify a higher PE, while slower growing or riskier businesses tend to trade on lower multiples.
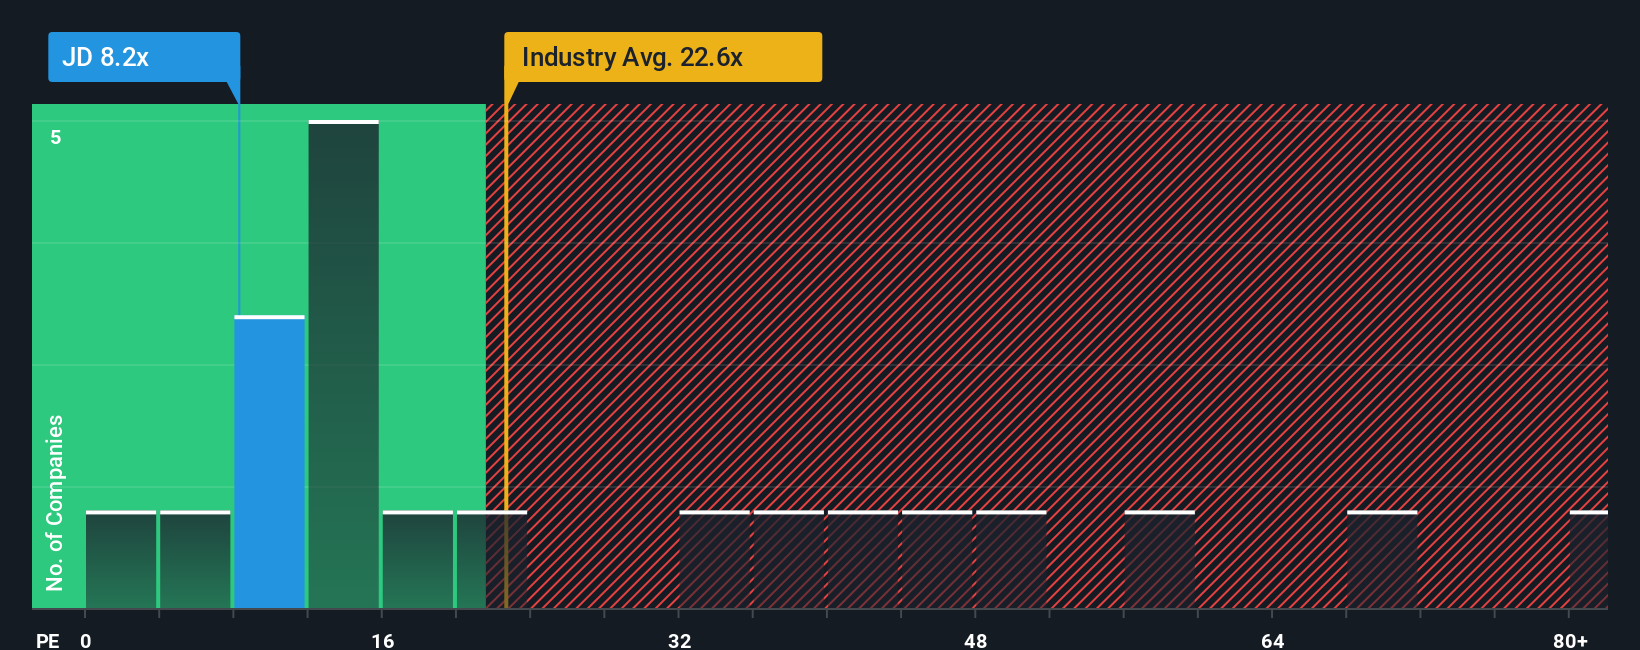
JD.com currently trades on a PE of about 9.2x. That is well below both the Multiline Retail industry average of around 19.9x and the broader peer group average of roughly 62.0x. On the surface, this makes the stock look cheap relative to its sector and competitors.
Simply Wall St also calculates a proprietary Fair Ratio of 24.1x for JD.com, which is the PE you might expect given its earnings growth profile, margins, industry, market cap and risk factors. This is more informative than a simple peer or industry comparison because it adjusts for how JD.com actually stacks up on quality and growth rather than assuming all retailers deserve the same multiple. With the shares on 9.2x compared to a Fair Ratio of 24.1x, JD.com screens as meaningfully undervalued on this measure.
Result: UNDERVALUED
PE ratios tell one story, but what if the real opportunity lies elsewhere? Discover 1450 companies where insiders are betting big on explosive growth.
Upgrade Your Decision Making: Choose your JD.com Narrative
Earlier we mentioned that there is an even better way to understand valuation, so let us introduce you to Narratives, a simple way to connect your view of JD.com’s story with a financial forecast and a Fair Value that you can compare to today’s share price.
A Narrative on Simply Wall St is your description of what you think will happen to a company, linked directly to your assumptions for future revenue, earnings and margins, and then translated into a Fair Value estimate that updates as those numbers change.
Within the Community page, millions of investors use Narratives as an easy tool to support their decision process. They can ask a clear question. For example, if a Narrative says JD.com is worth $60.47 but the market prices it nearer $28.04, does that gap justify taking action or waiting?
Because Narratives are dynamic, they automatically refresh when new information arrives, such as earnings, major news or analyst revisions. This helps your JD.com Fair Value stay aligned with the latest data while still reflecting your own, clearly documented story about the business.
Do you think there's more to the story for JD.com? Head over to our Community to see what others are saying!

This article by Simply Wall St is general in nature. We provide commentary based on historical data and analyst forecasts only using an unbiased methodology and our articles are not intended to be financial advice. It does not constitute a recommendation to buy or sell any stock, and does not take account of your objectives, or your financial situation. We aim to bring you long-term focused analysis driven by fundamental data. Note that our analysis may not factor in the latest price-sensitive company announcements or qualitative material. Simply Wall St has no position in any stocks mentioned.
Have feedback on this article? Concerned about the content? Get in touch with us directly. Alternatively, email editorial-team@simplywallst.com