
- If you are wondering whether Brookfield Business Partners is still a value play after its strong run, or if most of the upside is already priced in, you are not alone. That is exactly what this breakdown is going to tackle.
- The stock has climbed 4.4% over the last week and 1.2% over the past month. Those short term moves sit on top of a 48.0% year to date gain and a 108.3% return over three years.
- Those returns have been supported by Brookfield Business Partners continuing to reshuffle its portfolio with asset sales and acquisitions that aim to crystallize value and recycle capital into higher return opportunities. Management has also remained active in highlighting long term value creation through operational turnarounds and deleveraging moves across its businesses, which can influence how the market prices the partnership's risk and reward profile.
- Even after that performance, Brookfield Business Partners scores a 4 out of 6 on our valuation checks, suggesting the market may not fully reflect its fundamentals yet. In the next sections, we will unpack how different valuation methods line up, before finishing with a more holistic way to think about what this business could be worth.
Approach 1: Brookfield Business Partners Discounted Cash Flow (DCF) Analysis
A Discounted Cash Flow model estimates what a business is worth by projecting the cash it can generate in the future and then discounting those cash flows back to today using a required rate of return.
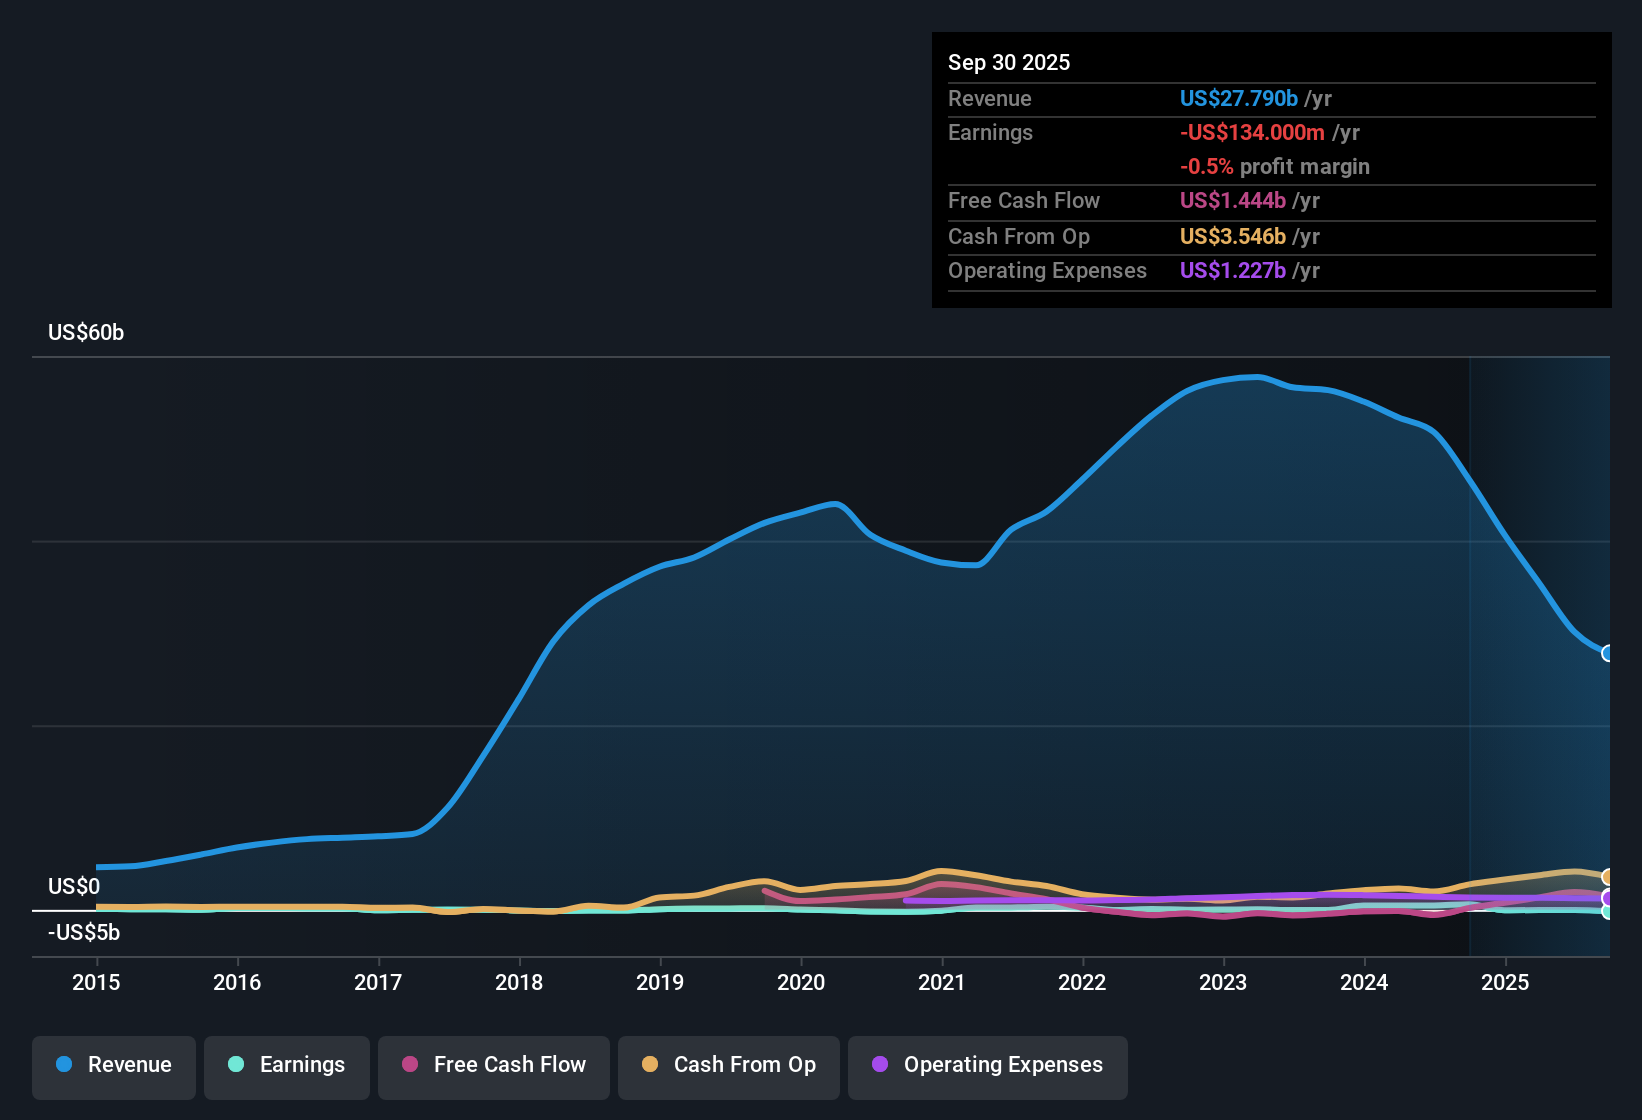
For Brookfield Business Partners, the latest twelve months Free Cash Flow is about $2.1 billion. Using a two stage Free Cash Flow to Equity model, Simply Wall St first applies analyst estimates and then extrapolates further growth, projecting FCF to rise to roughly $30.1 billion by 2035 as the partnership continues to scale and optimize its portfolio.
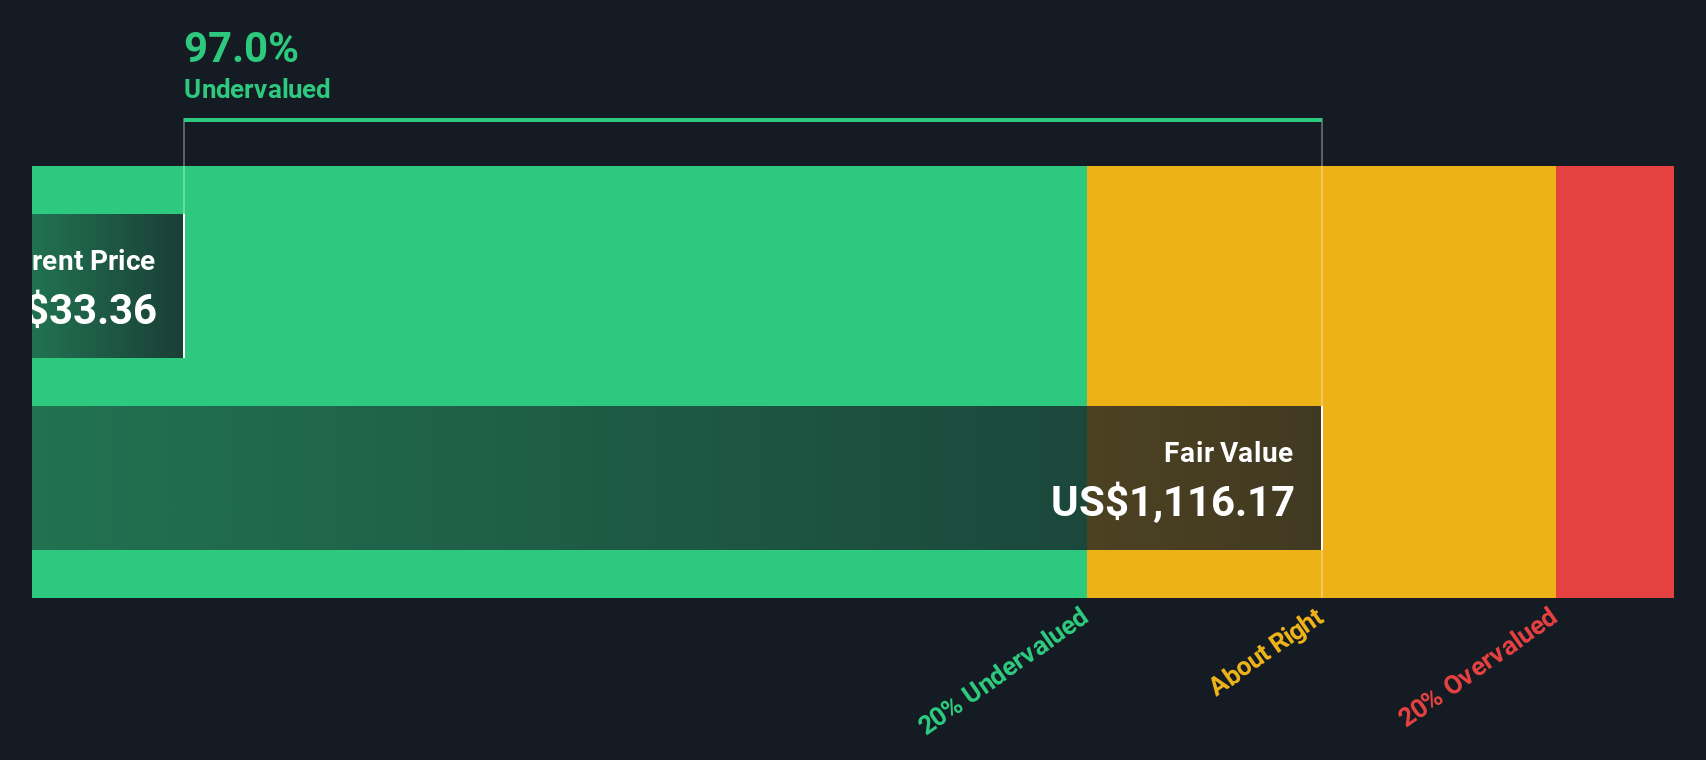
When all projected cash flows are discounted back and combined with a terminal value, the model arrives at an intrinsic value of about $891.75 per unit. Relative to the current unit price, this indicates the units are trading at roughly a 96.1% discount to their estimated fair value. This suggests that the market is heavily discounting Brookfield Business Partners future cash generation potential.
Result: UNDERVALUED
Our Discounted Cash Flow (DCF) analysis suggests Brookfield Business Partners is undervalued by 96.1%. Track this in your watchlist or portfolio, or discover 916 more undervalued stocks based on cash flows.
Approach 2: Brookfield Business Partners Price vs Sales
For asset heavy, often cyclical businesses like Brookfield Business Partners, the price to sales ratio is a useful way to value the units because it focuses on how much investors are paying for each dollar of revenue, regardless of short term earnings volatility. In general, higher growth and lower risk justify a higher price to sales multiple, while slower growth or elevated leverage should pull that multiple down.
Brookfield Business Partners currently trades at about 0.27x sales, which is well below both the Industrials sector average of around 0.83x and its peer group, which averages roughly 1.24x. Simply Wall St also uses a proprietary Fair Ratio framework, which estimates what a normal price to sales multiple should be once the company’s growth prospects, profitability profile, size and risk characteristics are factored in, rather than relying only on blunt peer or industry comparisons.
Because this Fair Ratio is tailored to Brookfield Business Partners specific fundamentals, it is a more nuanced benchmark for what investors may be willing to pay for its revenue base. On balance, the current 0.27x multiple screens as materially below what the Fair Ratio would imply.
Result: UNDERVALUED

PS ratios tell one story, but what if the real opportunity lies elsewhere? Discover 1443 companies where insiders are betting big on explosive growth.
Upgrade Your Decision Making: Choose your Brookfield Business Partners Narrative
Earlier we mentioned that there is an even better way to understand valuation, so let us introduce you to Narratives. This is a simple way to connect your view of the Brookfield Business Partners story with the numbers that sit behind it, including your assumptions for future revenue, earnings, margins and ultimately fair value.
A Narrative starts with your perspective on the business, then links that story to a structured financial forecast, and finally to an estimated fair value that you can compare with the current unit price to consider whether Brookfield Business Partners looks like a buy, a hold, or a sell.
On Simply Wall St, millions of investors build and share these Narratives on the Community page. Each one is kept up to date as new information, such as earnings results or major news, automatically refreshes the underlying forecasts and fair value estimate.
For example, one Brookfield Business Partners Narrative might assume conservative growth, lower margins and a modest fair value. Another could reflect a more optimistic view with faster growth, higher margins and a significantly higher fair value, giving you a clear sense of how different stories are associated with different investment decisions.
Do you think there's more to the story for Brookfield Business Partners? Head over to our Community to see what others are saying!
This article by Simply Wall St is general in nature. We provide commentary based on historical data and analyst forecasts only using an unbiased methodology and our articles are not intended to be financial advice. It does not constitute a recommendation to buy or sell any stock, and does not take account of your objectives, or your financial situation. We aim to bring you long-term focused analysis driven by fundamental data. Note that our analysis may not factor in the latest price-sensitive company announcements or qualitative material. Simply Wall St has no position in any stocks mentioned.
Have feedback on this article? Concerned about the content? Get in touch with us directly. Alternatively, email editorial-team@simplywallst.com