
- Wondering whether Quest Diagnostics is a hidden gem or trading above its true worth? You're not alone, as many investors are taking a closer look.
- Shares have posted an impressive gain of 25.7% year-to-date, with a 69.7% climb over the last five years. However, the past week saw a modest dip of 0.8%.
- Recent headlines have highlighted Quest Diagnostics’ ongoing expansion efforts and strategic partnerships. These developments suggest the market is reacting to more than just routine business performance. These moves have sparked plenty of interest, as investors consider how the company’s positioning might influence longer-term returns.
- The company earns a 4 out of 6 on our valuation scorecard, indicating it is undervalued in several key areas. In the next sections, we will look at what goes into that score and compare the main approaches to valuing Quest Diagnostics. Be sure to stick around for a deeper perspective that could help decode valuation even further.
Approach 1: Quest Diagnostics Discounted Cash Flow (DCF) Analysis
The Discounted Cash Flow (DCF) model estimates a company's intrinsic value by projecting its future cash flows and discounting them back to their present value. This approach focuses on how much cash Quest Diagnostics is expected to generate over time, as assessed today.
Quest Diagnostics' current Free Cash Flow is approximately $1.39 Billion. Analyst forecasts predict free cash flows to fluctuate in the coming years, with projections such as $1.18 Billion in 2027. In addition to analyst estimates, further projections are extrapolated by Simply Wall St, showing moderate adjustments through 2035. These projections help provide a more complete long-term picture for investors considering the company’s ongoing performance.
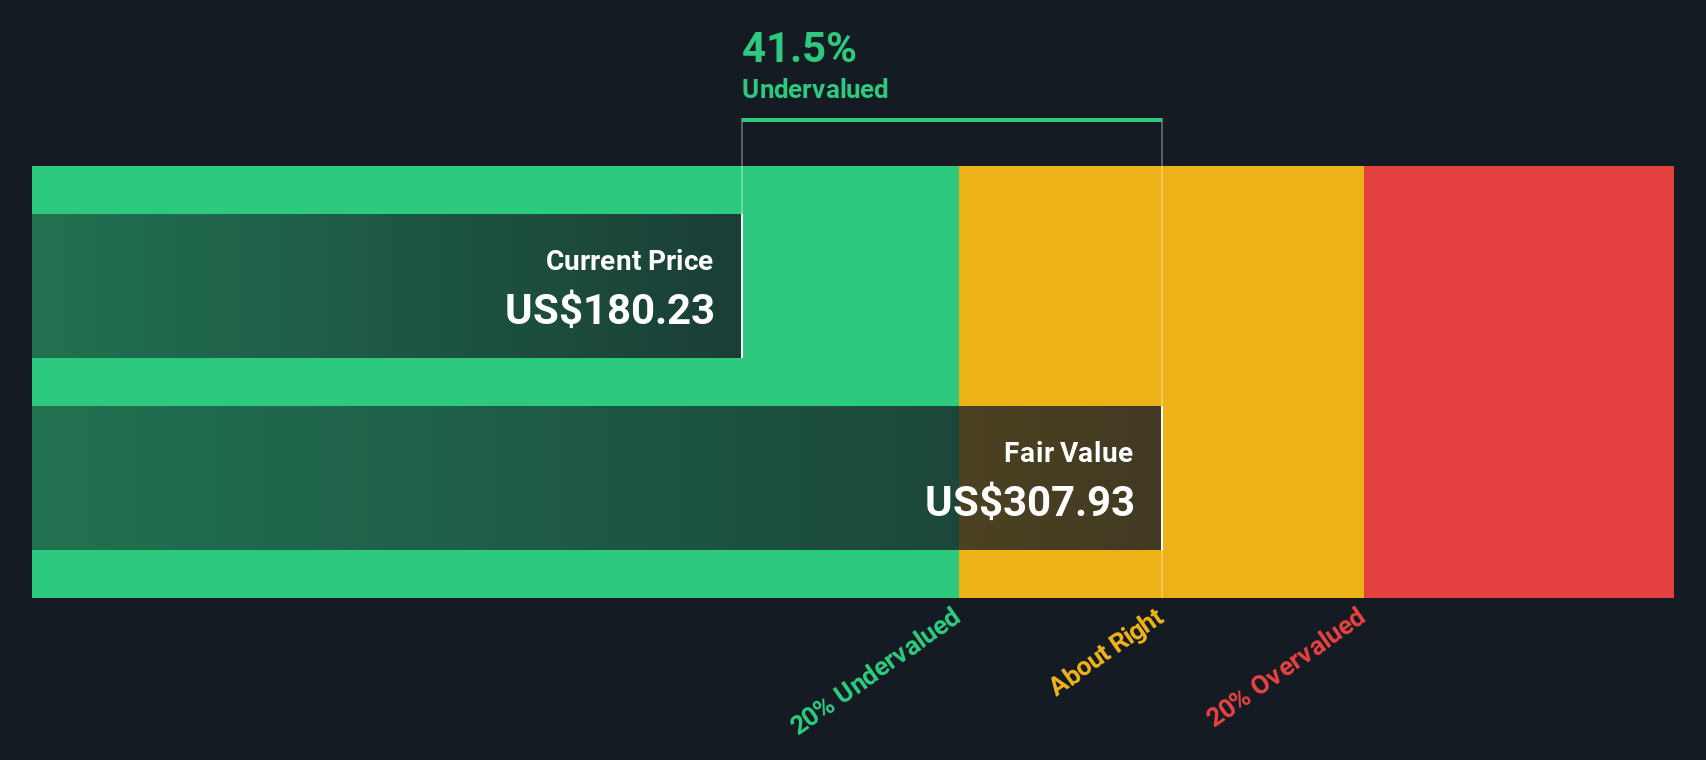
Based on this DCF analysis, the estimated intrinsic value for Quest Diagnostics shares is $224.73. At today's share price, this suggests the stock is 15.6% undervalued compared to its projected future cash flows.
Result: UNDERVALUED
Our Discounted Cash Flow (DCF) analysis suggests Quest Diagnostics is undervalued by 15.6%. Track this in your watchlist or portfolio, or discover 925 more undervalued stocks based on cash flows.
Approach 2: Quest Diagnostics Price vs Earnings
The Price-to-Earnings (PE) ratio is a widely respected valuation metric for profitable companies like Quest Diagnostics because it shows how much investors are willing to pay for a dollar of current earnings. It works especially well for companies with stable profitability, as is the case here.
Growth expectations and risk levels are important in determining a “normal” or “fair” PE ratio. If a company is expected to grow rapidly or has lower risk, a higher PE might be justified. Conversely, slower growth or higher risk often leads to a lower fair PE ratio. This context helps investors see whether the market’s pricing reflects genuine potential or simply optimism.
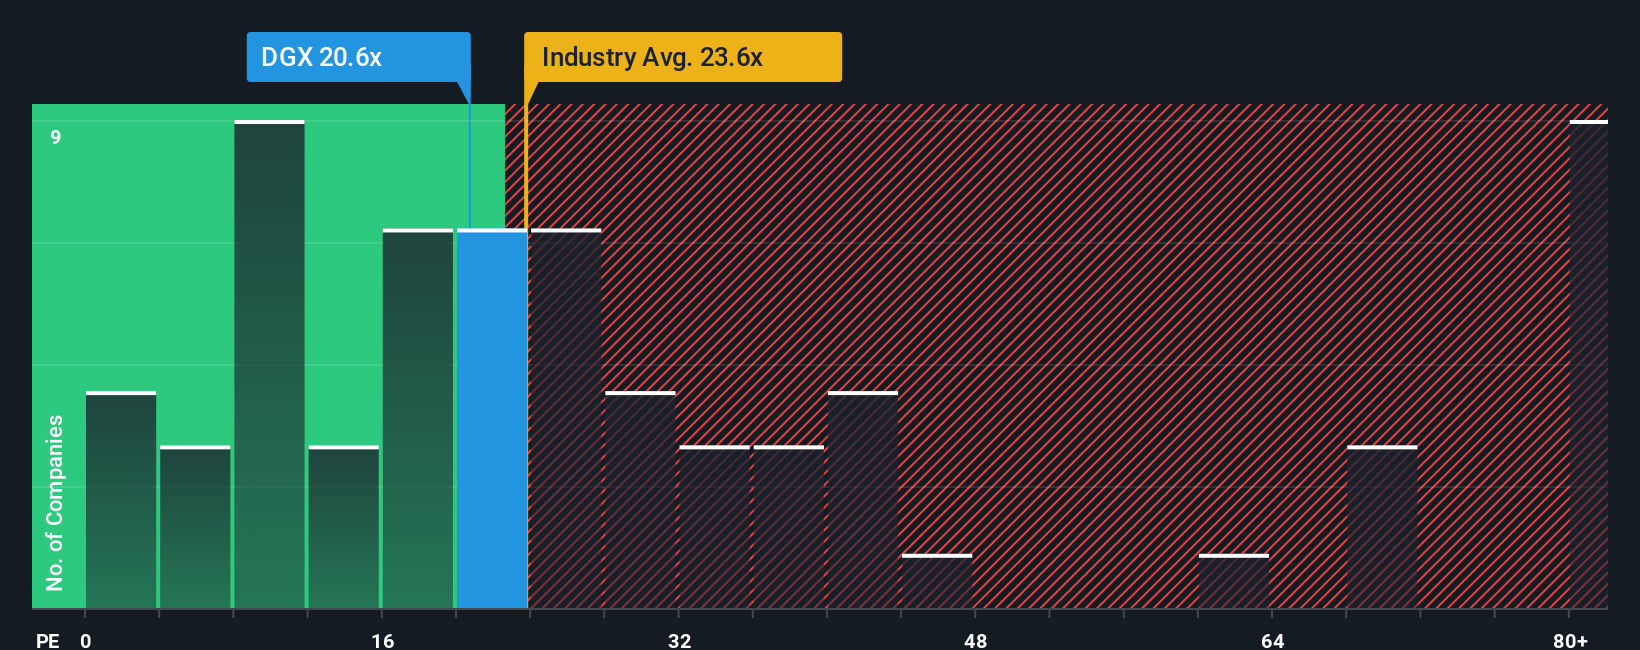
Quest Diagnostics currently trades at a PE ratio of 21.9x. This is just below the Healthcare industry average PE of 22.8x and noticeably below its average peer PE of 31.9x. To get an even more accurate sense of value, Simply Wall St calculates a proprietary "Fair Ratio" in this case, 24.2x that takes into account not just the industry and peers, but factors like Quest’s earnings growth, profit margins, market cap, and business risks.
Unlike simple peer or industry comparisons, the Fair Ratio gives a more tailored benchmark for Quest Diagnostics. By considering the full context of the company's financials and operating outlook, it provides a clearer signal of genuine value for investors.
Comparing Quest Diagnostics’ actual PE of 21.9x to the Fair Ratio of 24.2x, the stock appears undervalued by this measure.
Result: UNDERVALUED
PE ratios tell one story, but what if the real opportunity lies elsewhere? Discover 1438 companies where insiders are betting big on explosive growth.
Upgrade Your Decision Making: Choose your Quest Diagnostics Narrative
Earlier we mentioned that there is an even better way to understand valuation, so let's introduce you to Narratives, a smarter, more dynamic approach available to all investors on Simply Wall St’s Community page.
A Narrative is a story-driven perspective on a company, created by users to connect their view of its prospects with a structured financial forecast, including their estimated fair value and assumptions for future revenue, earnings, and margins.
This approach goes beyond the numbers by linking Quest Diagnostics’ unique business story, such as expanding testing innovations or facing reimbursement pressures, to forecasts and real-world events. This helps investors interpret fair value in the context of the latest developments.
Narratives make it easy to compare your Fair Value to the current Price, all while staying up-to-date as new information like earnings or news automatically refreshes the outlook.
For example, one Quest Diagnostics Narrative might focus on growth from advanced diagnostics and partnerships, supporting a higher fair value. Another might emphasize reimbursement risks and rising costs, resulting in a more conservative valuation. This shows how different investors can easily compare, discuss, and update their perspectives.
Do you think there's more to the story for Quest Diagnostics? Head over to our Community to see what others are saying!
This article by Simply Wall St is general in nature. We provide commentary based on historical data and analyst forecasts only using an unbiased methodology and our articles are not intended to be financial advice. It does not constitute a recommendation to buy or sell any stock, and does not take account of your objectives, or your financial situation. We aim to bring you long-term focused analysis driven by fundamental data. Note that our analysis may not factor in the latest price-sensitive company announcements or qualitative material. Simply Wall St has no position in any stocks mentioned.
Have feedback on this article? Concerned about the content? Get in touch with us directly. Alternatively, email editorial-team@simplywallst.com