
See our latest analysis for Stepan.
Despite stronger fundamentals in parts of its portfolio, Stepan’s share price return has been under pressure, with a year-to-date decline of 28.1% and a 1-year total shareholder return of -38.8%. While a sharp 7.2% gain over the past week hints at some positive momentum, the longer-term trend has been challenging. The three- and five-year total shareholder returns are both down over 56%, reflecting a period of persistent headwinds even amidst recent growth signals.
If you’re interested in broadening your opportunities beyond Stepan, now could be an ideal moment to discover fast growing stocks with high insider ownership.
With recent gains offsetting some of the year’s declines, the key question remains: is Stepan trading at a meaningful discount based on fundamentals, or are markets fully pricing in its prospects for future growth?
Price-to-Earnings of 22.7x: Is it justified?
Stepan’s current price-to-earnings (P/E) ratio is 22.7x, slightly above the peer average of 21.2x, based on the last close price of $45.41. This positions the stock as more expensive relative to peers when assessed by this key valuation metric.
The P/E ratio shows what investors are willing to pay today for a dollar of Stepan’s earnings. For a specialty chemicals provider such as Stepan, the P/E helps gauge market expectations for future earnings potential, sector cyclicality, and company-specific growth outlooks.
Although Stepan trades at a premium to direct peers, it aligns with the broader US Chemicals industry average of 22.7x. Compared to its estimated fair P/E ratio of 28.1x, there appears to be some headroom, which may indicate the market could re-rate Stepan if fundamentals improve or growth increases.
Explore the SWS fair ratio for Stepan
Result: Price-to-Earnings of 22.7x (OVERVALUED)
However, risks such as ongoing share price volatility or changes in demand for specialty chemicals could quickly alter Stepan’s outlook and investor sentiment.
Find out about the key risks to this Stepan narrative.
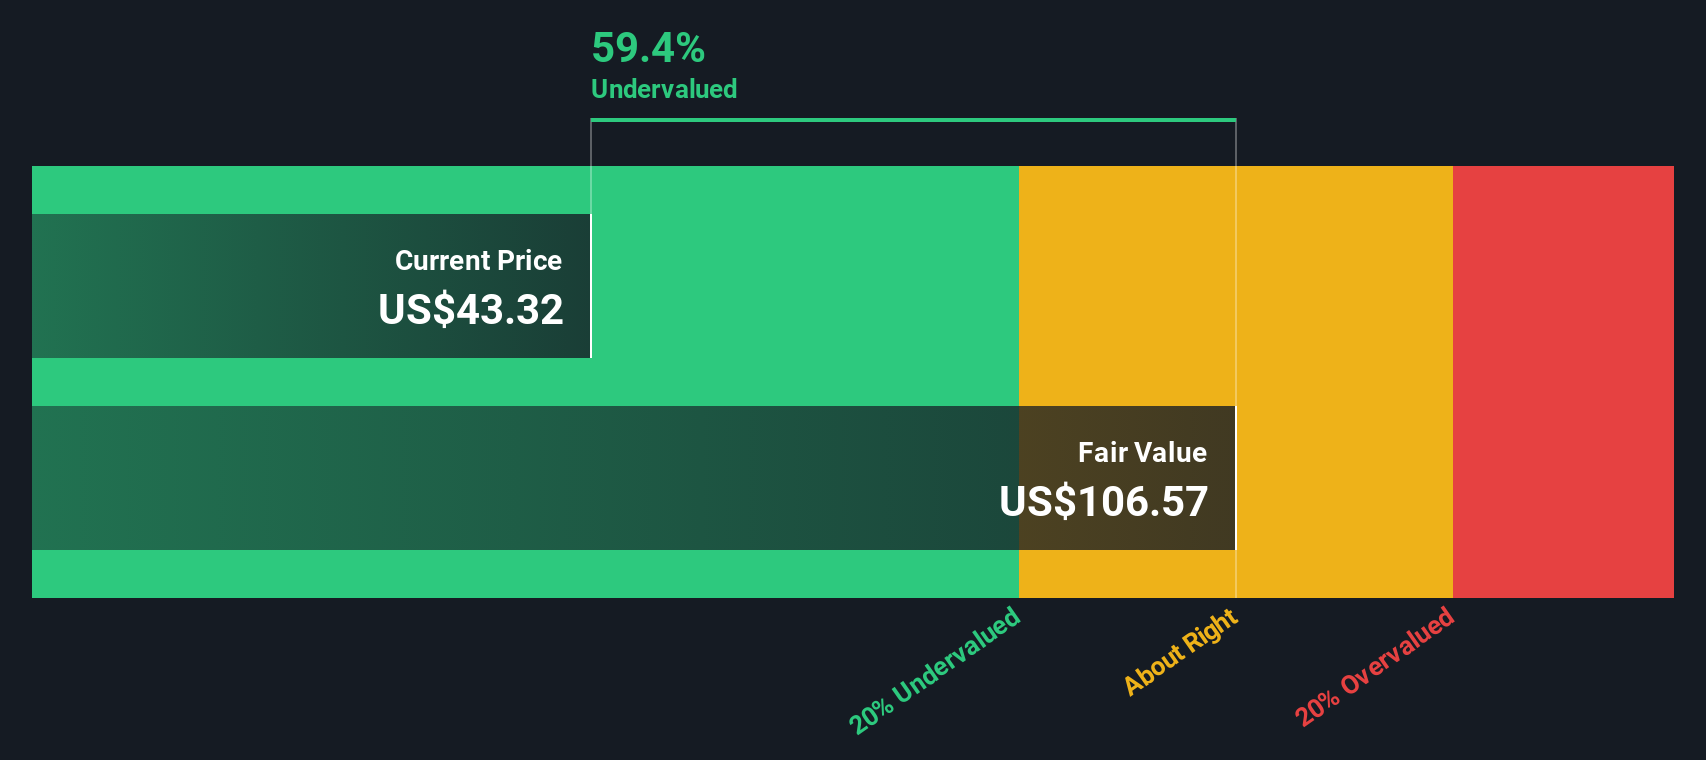
Another View: Our DCF Model Points to Deep Undervaluation
Taking a different approach, the SWS DCF model estimates Stepan's fair value at $107.65, which is significantly above the current share price. This method suggests Stepan is trading at a 57.8% discount compared to this valuation. This challenges the earlier assessment that the stock appears expensive based on earnings. Which perspective do you find more compelling?
Look into how the SWS DCF model arrives at its fair value.
Simply Wall St performs a discounted cash flow (DCF) on every stock in the world every day (check out Stepan for example). We show the entire calculation in full. You can track the result in your watchlist or portfolio and be alerted when this changes, or use our stock screener to discover 928 undervalued stocks based on their cash flows. If you save a screener we even alert you when new companies match - so you never miss a potential opportunity.
Build Your Own Stepan Narrative
If you have different perspectives or want to dive deeper into Stepan’s figures, you can easily craft your own analysis and story in just minutes. Do it your way.
A great starting point for your Stepan research is our analysis highlighting 2 key rewards and 2 important warning signs that could impact your investment decision.
Ready for Your Next Smart Move?
Don’t let opportunity pass you by. Make the most of powerful data-driven ideas curated by the Simply Wall Street Screener and stay ahead of the market.
- Boost your portfolio with high-potential opportunities by targeting these 3579 penny stocks with strong financials showing strong fundamentals and growth momentum.
- Capture long-term value by tracking these 928 undervalued stocks based on cash flows that are trading below their intrinsic worth, giving you an edge on undervalued picks.
- Tap into tomorrow’s technology with these 25 AI penny stocks, connecting you to the most innovative businesses harnessing artificial intelligence right now.
This article by Simply Wall St is general in nature. We provide commentary based on historical data and analyst forecasts only using an unbiased methodology and our articles are not intended to be financial advice. It does not constitute a recommendation to buy or sell any stock, and does not take account of your objectives, or your financial situation. We aim to bring you long-term focused analysis driven by fundamental data. Note that our analysis may not factor in the latest price-sensitive company announcements or qualitative material. Simply Wall St has no position in any stocks mentioned.
Have feedback on this article? Concerned about the content? Get in touch with us directly. Alternatively, email editorial-team@simplywallst.com