
NewMarket (NEU) shares have maintained a steady path lately, attracting investor interest thanks to the company’s consistent returns over the past year. The stock’s performance has some market watchers re-examining its current valuation, particularly following a strong run.
See our latest analysis for NewMarket.
Momentum has been building for NewMarket, as its share price has jumped more than 50% year-to-date and the one-year total shareholder return clocks in at an impressive 43.7%. This surge suggests investors are optimistic about the company’s growth prospects and are rewarding consistent performance in a competitive market.
If you’re wondering what else might be taking off right now, this is a great moment to broaden your search and discover fast growing stocks with high insider ownership
With shares trading near all-time highs, investors are left to ask a critical question: is NewMarket’s strong momentum signaling more upside ahead, or has the stock’s growth story already been fully reflected in its price?
Price-to-Earnings of 16.1x: Is it justified?
NewMarket's shares are trading at a price-to-earnings ratio of 16.1x, which appears attractive when compared with listed peers in the sector and the broader market. At the last close of $766.61, this multiple points to a valuation that could offer relative value.
The price-to-earnings ratio (P/E) shows how much investors are willing to pay for each dollar of the company's earnings. For a chemicals sector business like NewMarket, the P/E can signal market optimism or skepticism about its future growth and earnings consistency.
NewMarket’s P/E of 16.1x is not only more favorable than the peer average of 18.2x, but it is also well below the US Chemicals industry average of 22.2x. This comparative discount suggests that the market may be underpricing NewMarket’s demonstrated earnings power, particularly given its strong historical profit growth. While the fair ratio for valuation is not available, this notable gap compared to industry and peers highlights a potential opportunity for investors who believe the company can maintain or accelerate its profit run.
See what the numbers say about this price — find out in our valuation breakdown.
Result: Price-to-Earnings of 16.1x (UNDERVALUED)
However, shifts in market sentiment or weaker industry demand could quickly challenge NewMarket’s valuation and put its recent momentum at risk.
Find out about the key risks to this NewMarket narrative.
Another View: Discounted Cash Flow Perspective
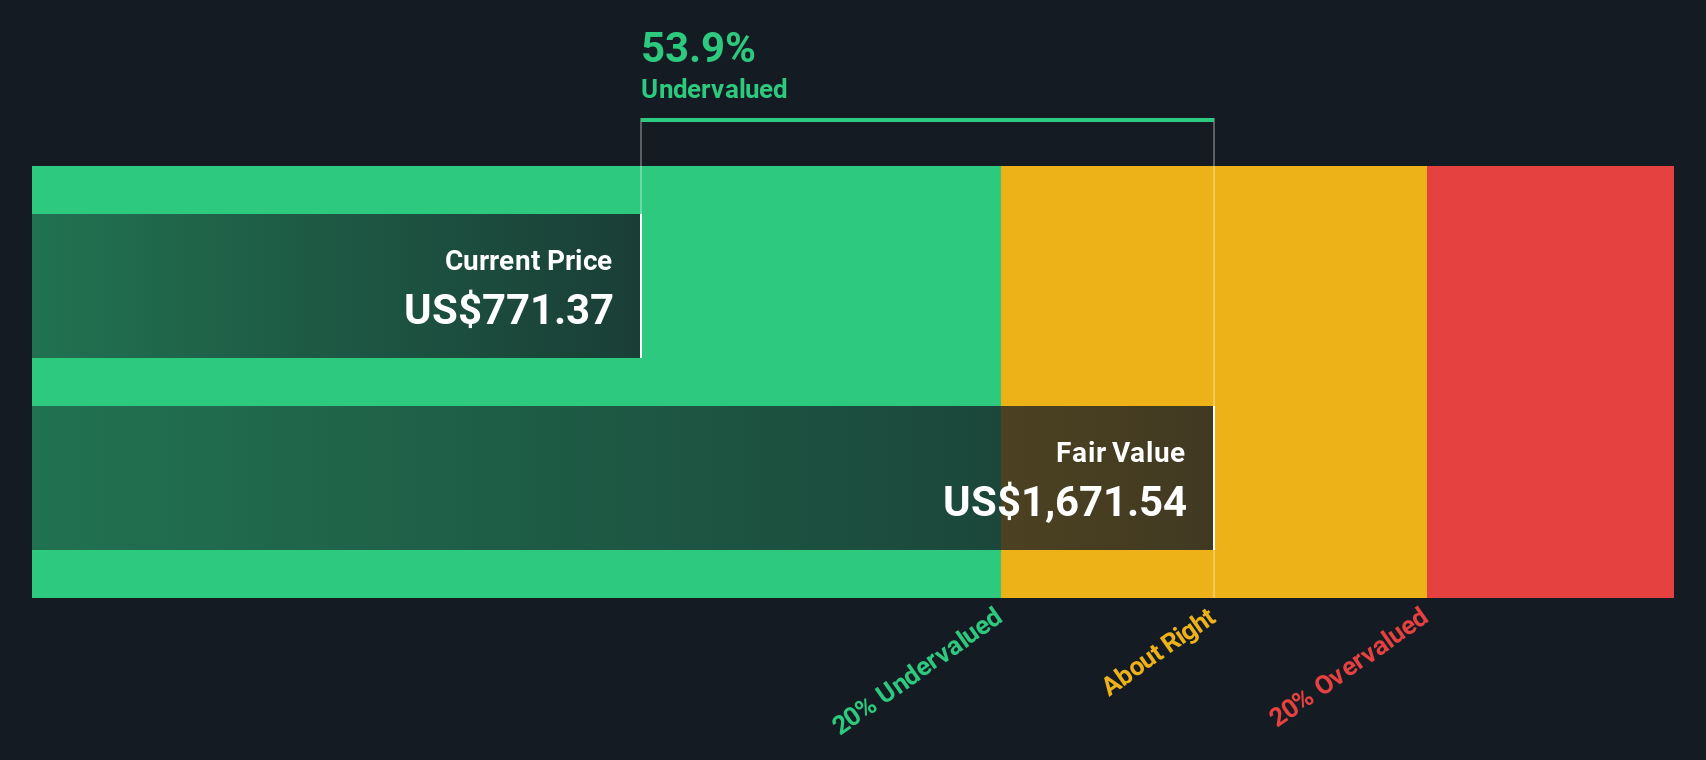
Looking through the lens of our DCF model, NewMarket appears to be trading 54% below its estimated fair value of $1,667.87. This suggests a much greater undervaluation than the simpler P/E comparison indicates. However, when two models diverge, which one provides a clearer view of future prospects?
Look into how the SWS DCF model arrives at its fair value.
Simply Wall St performs a discounted cash flow (DCF) on every stock in the world every day (check out NewMarket for example). We show the entire calculation in full. You can track the result in your watchlist or portfolio and be alerted when this changes, or use our stock screener to discover 924 undervalued stocks based on their cash flows. If you save a screener we even alert you when new companies match - so you never miss a potential opportunity.
Build Your Own NewMarket Narrative
If you have a different perspective or want to see the numbers for yourself, you can quickly put together your own view in just minutes with Do it your way.
A great starting point for your NewMarket research is our analysis highlighting 3 key rewards and 1 important warning sign that could impact your investment decision.
Looking for more investment ideas?
Don’t let fresh opportunities slip away. The market is full of standout stocks tapping into powerful trends, and the right screener makes all the difference.
- Spot huge value gaps by checking out these 924 undervalued stocks based on cash flows which trade well below their intrinsic worth, so you can find potential bargains before the crowd.
- Capture passive income streams by tapping into these 14 dividend stocks with yields > 3% offering yields greater than 3%, helping you build lasting wealth with reliable payments.
- Capitalize on high-growth technology by targeting these 26 quantum computing stocks at the forefront of next-generation computing innovation and disruptive breakthroughs.
This article by Simply Wall St is general in nature. We provide commentary based on historical data and analyst forecasts only using an unbiased methodology and our articles are not intended to be financial advice. It does not constitute a recommendation to buy or sell any stock, and does not take account of your objectives, or your financial situation. We aim to bring you long-term focused analysis driven by fundamental data. Note that our analysis may not factor in the latest price-sensitive company announcements or qualitative material. Simply Wall St has no position in any stocks mentioned.
Have feedback on this article? Concerned about the content? Get in touch with us directly. Alternatively, email editorial-team@simplywallst.com