
NewMarket (NEU) shares have edged higher lately, drawing attention as investors sort through recent trading trends and overall valuation. While there is no headline-making event at the moment, the stock’s momentum is prompting a closer look at what is driving interest.
See our latest analysis for NewMarket.
NewMarket’s share price momentum has caught investors’ attention, with the stock up more than 50% year-to-date despite a recent pullback. Over the long haul, its total shareholder return stands out even more, with a 49% gain in the past year and a remarkable 169% over three years. This signals robust compounding for long-term holders.
If strong compounding and price runs like these have you curious, this could be the perfect moment to discover fast growing stocks with high insider ownership.
The key question now is whether NewMarket's current price reflects all of its impressive gains, or if there is unmet potential that could signal a new buying opportunity for investors seeking future growth.
Price-to-Earnings of 16.2x: Is it justified?
NewMarket is currently trading at a price-to-earnings (P/E) ratio of 16.2x, slightly higher than the average of its peers at 15.6x. This suggests investors are willing to pay a small premium for each dollar of company earnings compared with others in the same sector.
The price-to-earnings multiple measures how much investors are willing to pay today for a dollar of current earnings. In the chemicals industry, this ratio is a key reference point for comparing companies' profitability and expectations for future growth. A higher-than-peer P/E can indicate market confidence in a company's stability, track record, or perceived growth potential.
Despite trading higher than the peer average, NewMarket trades at a discount when compared to its broader industry. Its P/E of 16.2x is well below the US Chemicals industry average of 24.7x. This suggests the market still sees it as comparatively good value relative to other stocks in its sector.
See what the numbers say about this price — find out in our valuation breakdown.
Result: Price-to-Earnings of 16.2x (ABOUT RIGHT)
However, sustained momentum is not guaranteed. Any slowdown in core earnings growth or sector-wide downturns could quickly cool investor enthusiasm.
Find out about the key risks to this NewMarket narrative.
Another View: Discounted Cash Flow Perspective
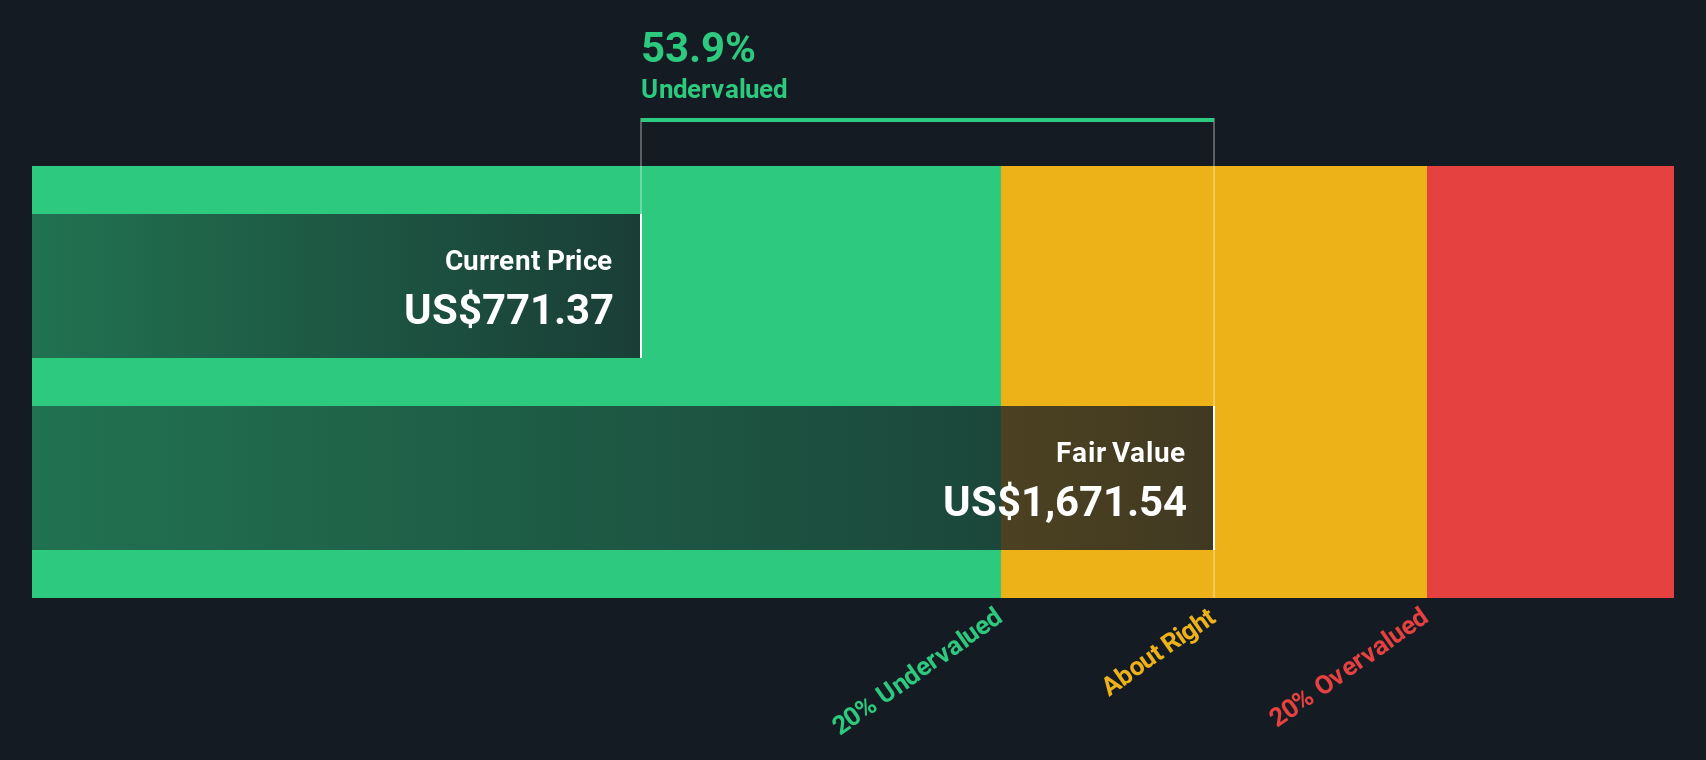
While NewMarket’s price-to-earnings ratio suggests relative value versus its industry, our DCF model takes a longer-term view of the company's cash flows. Using this approach, the current price of $767.9 is approximately 53% below our estimated fair value of $1,619.23. This indicates a potential undervaluation.
Look into how the SWS DCF model arrives at its fair value.
Simply Wall St performs a discounted cash flow (DCF) on every stock in the world every day (check out NewMarket for example). We show the entire calculation in full. You can track the result in your watchlist or portfolio and be alerted when this changes, or use our stock screener to discover 843 undervalued stocks based on their cash flows. If you save a screener we even alert you when new companies match - so you never miss a potential opportunity.
Build Your Own NewMarket Narrative
If you'd rather take your own approach or have a different perspective, you can dig into the numbers and shape your own view in just a few minutes. Do it your way.
A great starting point for your NewMarket research is our analysis highlighting 3 key rewards and 1 important warning sign that could impact your investment decision.
Looking for More Smart Investment Opportunities?
Don’t miss your shot at finding tomorrow’s winners. The right opportunities are out there, but you have to be quick to spot them before the crowd.
- Start building long-term income by tapping into these 20 dividend stocks with yields > 3% with robust yields and reliable payouts.
- Catch the next surge in technology with these 27 AI penny stocks at the forefront of artificial intelligence innovation and disruption.
- Unlock value by targeting these 843 undervalued stocks based on cash flows, which are powered by strong cash flows and often overlooked by most investors.
This article by Simply Wall St is general in nature. We provide commentary based on historical data and analyst forecasts only using an unbiased methodology and our articles are not intended to be financial advice. It does not constitute a recommendation to buy or sell any stock, and does not take account of your objectives, or your financial situation. We aim to bring you long-term focused analysis driven by fundamental data. Note that our analysis may not factor in the latest price-sensitive company announcements or qualitative material. Simply Wall St has no position in any stocks mentioned.
Have feedback on this article? Concerned about the content? Get in touch with us directly. Alternatively, email editorial-team@simplywallst.com