
Brookfield Business (NYSE:BBUC) has been on investors’ radars lately as its stock delivers a steady performance, climbing 11% over the past 3 months. The company’s recent track record has sparked curiosity about what is driving these moves.
See our latest analysis for Brookfield Business.
Brookfield Business has seen real momentum this year, with a 38.2% year-to-date share price return and a 35.2% total shareholder return over the past 12 months. Despite a pullback in recent days, this performance suggests optimism is building around its outlook and valuation.
If these moves have you thinking about expanding your investment universe, it could be the perfect time to discover fast growing stocks with high insider ownership
With such strong gains behind it, investors now face a critical question: Is Brookfield Business trading at a compelling valuation, or has the market already factored in the promise of future growth and left little room for upside?
Price-to-Sales of 0.3x: Is it justified?
Brookfield Business is currently trading at a price-to-sales ratio of just 0.3x, notably lower than its industry peers and last close price of $33.76. This low multiple positions BBUC as potentially undervalued when compared to both the broader Global Industrials industry and its direct competitors.
The price-to-sales (P/S) ratio measures a company’s market capitalization relative to its total revenue. For diversified industrial companies like Brookfield Business, the P/S ratio offers insight when earnings are negative or volatile. It can serve as a useful benchmark through industry cycles.
Brookfield Business’s P/S ratio of 0.3x stands out compared to industry peers, which average 0.8x. Direct competitors trend closer to 0.5x. This disparity could signal that investors remain cautious due to the company’s lack of current profitability, or that the market might be undervaluing BBUC’s revenue-generating potential if fortunes turn. If market perception changes and valuation multiples return to peer or industry levels, the stock price may move accordingly.
See what the numbers say about this price — find out in our valuation breakdown.
Result: Price-to-Sales of 0.3x (UNDERVALUED)
However, persistent net losses and a lack of clear annual revenue growth could still affect Brookfield Business’s valuation and near-term investor sentiment.
Find out about the key risks to this Brookfield Business narrative.
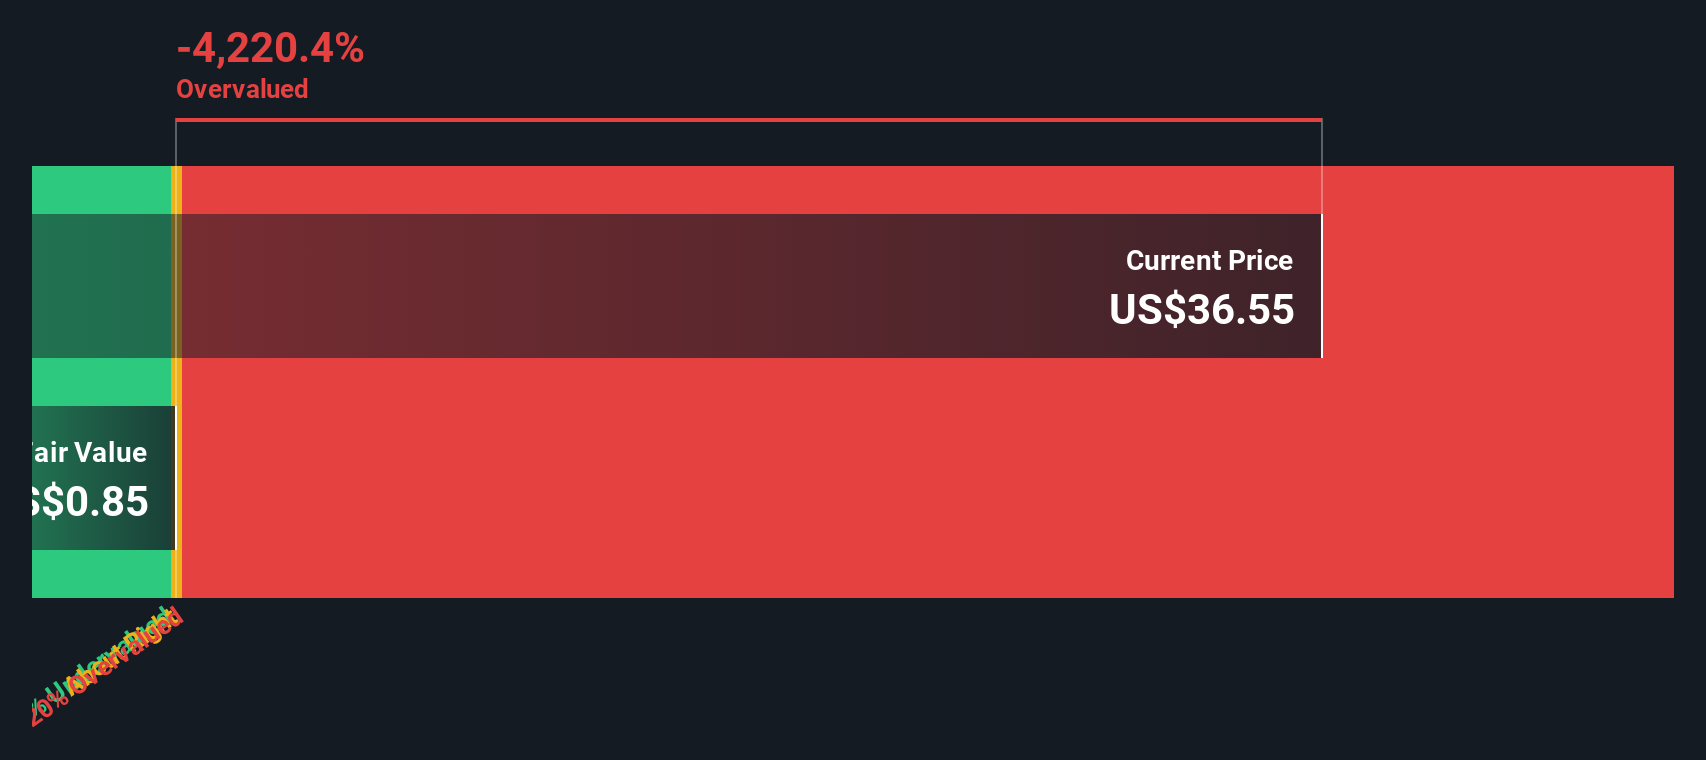
Another View: What Does the SWS DCF Model Say?
Taking a different approach, our DCF model estimates Brookfield Business’s fair value at just $0.85 per share, which is far below its recent $33.76 close. While the price-to-sales ratio suggests the stock is undervalued compared to peers, the DCF model presents a much more cautious picture and points to significant downside risk based on cash flow assumptions.
Look into how the SWS DCF model arrives at its fair value.
Simply Wall St performs a discounted cash flow (DCF) on every stock in the world every day (check out Brookfield Business for example). We show the entire calculation in full. You can track the result in your watchlist or portfolio and be alerted when this changes, or use our stock screener to discover undervalued stocks based on their cash flows. If you save a screener we even alert you when new companies match - so you never miss a potential opportunity.
Build Your Own Brookfield Business Narrative
If you want to compare your perspective or dig deeper into the numbers on your own, you can piece together your own view in just minutes. Do it your way.
A great starting point for your Brookfield Business research is our analysis highlighting 2 important warning signs that could impact your investment decision.
Looking for more investment ideas?
Expand your investing universe now and uncover new opportunities that most investors are missing. Get a front-row seat to fresh trends and sectors showing real momentum.
- Unlock growth potential by checking out these 24 AI penny stocks that could benefit from the rapid adoption of artificial intelligence across industries.
- Boost your income strategy with these 19 dividend stocks with yields > 3% offering attractive yields above 3% for reliable returns in any market condition.
- Gain early exposure to cutting-edge digital finance by exploring these 79 cryptocurrency and blockchain stocks paving the way in blockchain technology and cryptocurrency innovation.
This article by Simply Wall St is general in nature. We provide commentary based on historical data and analyst forecasts only using an unbiased methodology and our articles are not intended to be financial advice. It does not constitute a recommendation to buy or sell any stock, and does not take account of your objectives, or your financial situation. We aim to bring you long-term focused analysis driven by fundamental data. Note that our analysis may not factor in the latest price-sensitive company announcements or qualitative material. Simply Wall St has no position in any stocks mentioned.
Have feedback on this article? Concerned about the content? Get in touch with us directly. Alternatively, email editorial-team@simplywallst.com