
If you’re eyeing Aspen Insurance Holdings and wondering whether it’s time to take action, you’re certainly not alone. The stock has caught attention lately, especially after a standout 31.2% jump over the past month. Year to date, Aspen’s up a solid 12.7% as well, easily outpacing the market average. While the seven-day return is nearly flat at 0.1%, that run-up over the past month has understandably sparked fresh debates: are investors belatedly recognizing Aspen’s growth story, or is this just a short-term spike reflecting broader shifts in risk sentiment within the insurance sector?
Making sense of moves like this isn’t just about tracking price ticks, though. Ultimately, what matters is value: Is Aspen still undervalued after these big gains, or has the market finally caught up to its prospects? Our value score approach gives Aspen a 3 out of 6, meaning the company looks undervalued by half of the major checks we run. It is neither a screaming deal nor an overpriced risk.
The real question is which valuation methods matter most to Aspen, and should you trust basic multiples at face value? Let’s walk through the frameworks investors commonly use to evaluate this stock, and finish with a look at an even better way to judge Aspen’s real worth.
Aspen Insurance Holdings delivered 0.0% returns over the last year. See how this stacks up to the rest of the Insurance industry.Approach 1: Aspen Insurance Holdings Excess Returns Analysis
The Excess Returns valuation model focuses on a company’s ability to generate returns on its invested capital that exceed its cost of equity. Essentially, this approach checks how profitably Aspen Insurance Holdings is putting its money to work for shareholders, after taking into account all costs of capital. If the company’s returns consistently outperform what it costs to access that capital, there is potential for long-term value creation.
For Aspen, the key metrics stack up as follows:
- Book Value: $28.81 per share
- Stable Earnings Per Share (EPS): $4.94 per share
(Source: Weighted future Return on Equity estimates from 6 analysts.) - Cost of Equity: $2.36 per share
- Excess Return: $2.58 per share
- Average Return on Equity: 14.19%
- Stable Book Value: $34.80 per share
(Source: Weighted future Book Value estimates from 5 analysts.)
According to these numbers, Aspen’s return on equity meaningfully outpaces its cost of capital, signaling strong value creation potential. Using this model, the intrinsic value per share is $104.57. With the Excess Returns valuation showing a 65.0% discount from the current share price, Aspen Insurance Holdings appears significantly undervalued at present, suggesting the market may be overlooking its underlying profitability.
Result: UNDERVALUED
Head to the Valuation section of our Company Report for more details on how we arrive at this Fair Value for Aspen Insurance Holdings.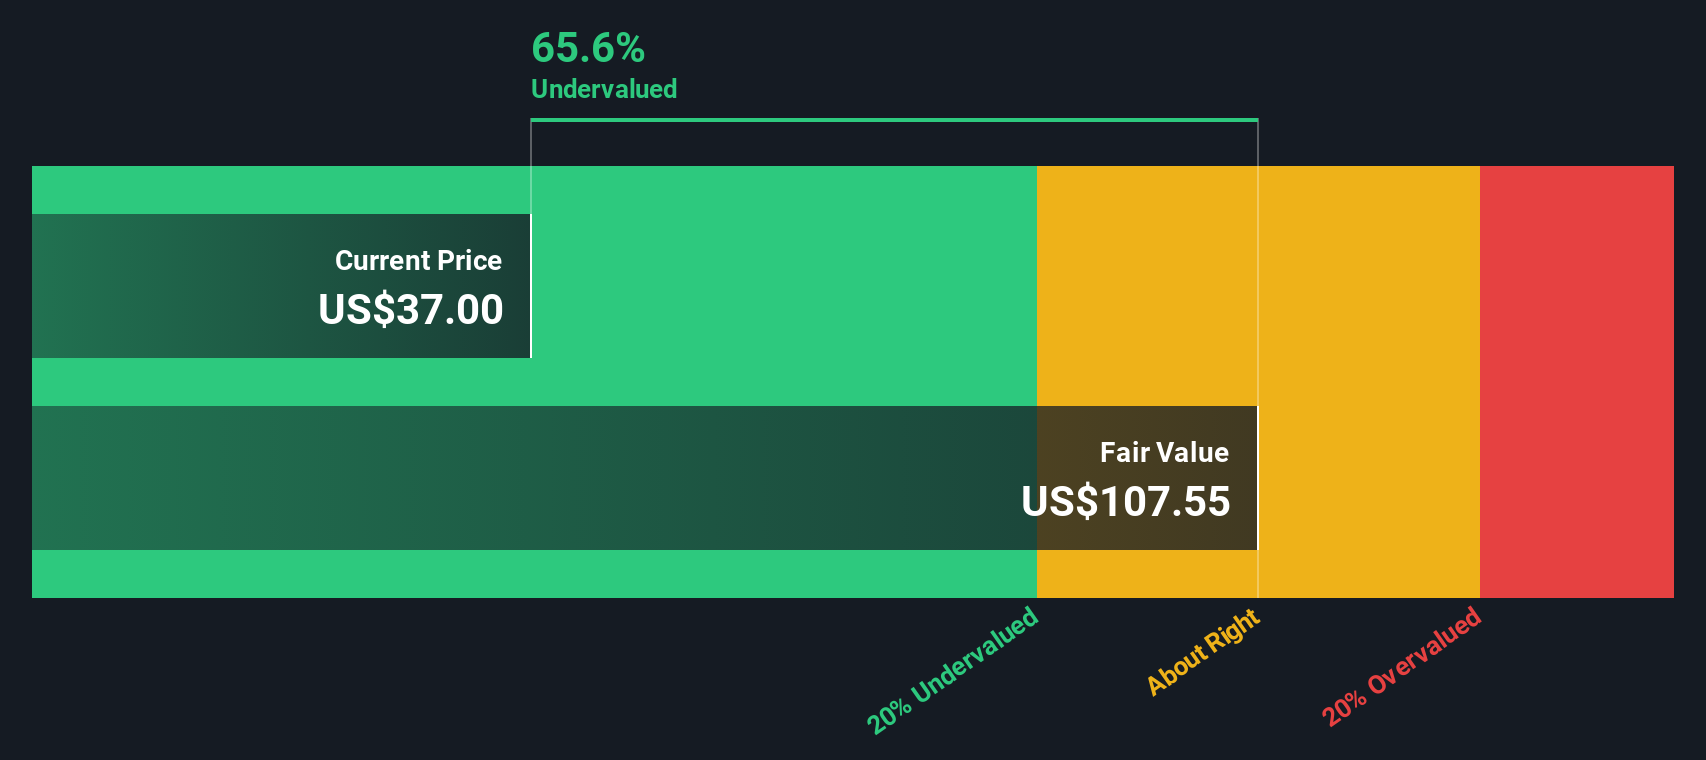
Approach 2: Aspen Insurance Holdings Price vs Earnings
For established, profitable companies like Aspen Insurance Holdings, the Price-to-Earnings (PE) ratio is often considered the most practical yardstick for valuation. This metric gauges how much investors are paying for each dollar of earnings, making it a straightforward way to compare profitability across companies and the broader market.
Of course, what qualifies as a “normal” or “fair” PE ratio isn’t set in stone. Factors such as expected earnings growth and underlying risk levels play a crucial role. Companies with stronger growth prospects or more stable businesses can usually justify higher PE multiples, while riskier or slower-growing firms tend to trade at lower ones.
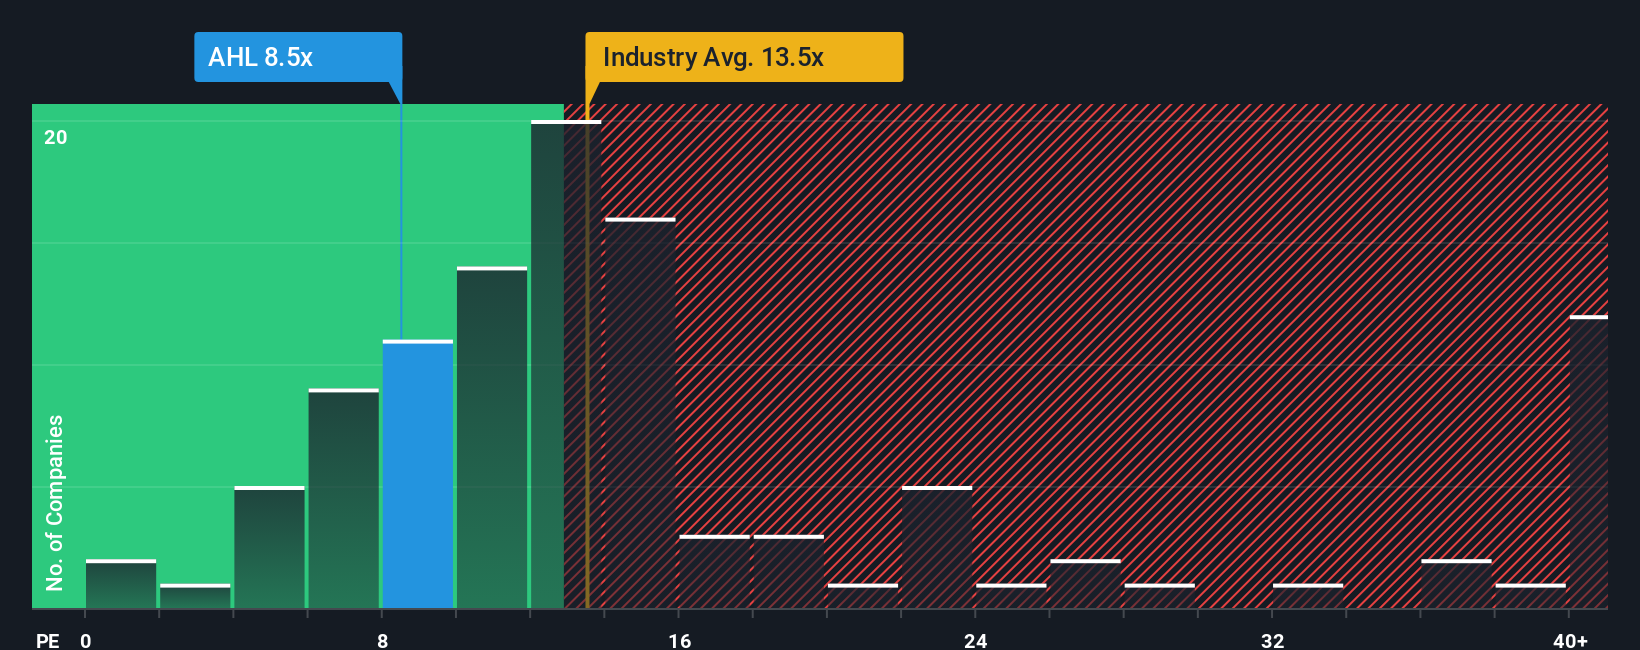
Currently, Aspen Insurance Holdings trades at a PE ratio of 10.10x. To put that in context, peers in the insurance sector are averaging a PE of 8.97x, while the industry overall sits at a higher 14.43x. While comparing with peers and industry averages provides some insight, Simply Wall St’s proprietary “Fair Ratio” takes the analysis further. Unlike simple averages, the Fair Ratio weighs in factors such as Aspen’s unique growth profile, risk, profit margins, industry position, and market capitalization to generate a tailored benchmark for what Aspen’s PE should be.
This approach is more sophisticated than one-size-fits-all comparisons and ensures we account for what really matters to Aspen’s valuation picture. In Aspen’s case, the Fair Ratio lands near its current PE. Given that the difference is less than 0.10, the stock appears fairly valued based on this method.
Result: ABOUT RIGHT
Upgrade Your Decision Making: Choose your Aspen Insurance Holdings Narrative
Earlier we mentioned that there is an even better way to understand valuation, so let us introduce you to Narratives. A Narrative goes beyond just the numbers by letting you build and share your personal story about a company, complete with your own assumptions for fair value, future revenue, earnings and margins. In short, a Narrative connects Aspen Insurance Holdings' story to a financial forecast, turning individual perspectives into a tailored fair value estimate.
This tool, available to everyone right on Simply Wall St’s Community page, is easy to use and harnessed by millions of investors. Narratives empower you to see at a glance when Aspen Insurance Holdings looks undervalued or overvalued by comparing your Fair Value to the current market Price. Since Narratives update dynamically whenever new info or earnings are released, you never miss an important shift. For instance, some investors’ Narratives put Aspen’s fair value over $120 per share, while others see it under $90, highlighting how different outlooks can coexist around the same stock.
Do you think there's more to the story for Aspen Insurance Holdings? Create your own Narrative to let the Community know!
This article by Simply Wall St is general in nature. We provide commentary based on historical data and analyst forecasts only using an unbiased methodology and our articles are not intended to be financial advice. It does not constitute a recommendation to buy or sell any stock, and does not take account of your objectives, or your financial situation. We aim to bring you long-term focused analysis driven by fundamental data. Note that our analysis may not factor in the latest price-sensitive company announcements or qualitative material. Simply Wall St has no position in any stocks mentioned.
Have feedback on this article? Concerned about the content? Get in touch with us directly. Alternatively, email editorial-team@simplywallst.com