
8 analysts have shared their evaluations of Procter & Gamble (NYSE:PG) during the recent three months, expressing a mix of bullish and bearish perspectives.
The table below offers a condensed view of their recent ratings, showcasing the changing sentiments over the past 30 days and comparing them to the preceding months.
| Bullish | Somewhat Bullish | Indifferent | Somewhat Bearish | Bearish | |
|---|---|---|---|---|---|
| Total Ratings | 1 | 3 | 4 | 0 | 0 |
| Last 30D | 0 | 1 | 0 | 0 | 0 |
| 1M Ago | 1 | 1 | 2 | 0 | 0 |
| 2M Ago | 0 | 0 | 2 | 0 | 0 |
| 3M Ago | 0 | 1 | 0 | 0 | 0 |
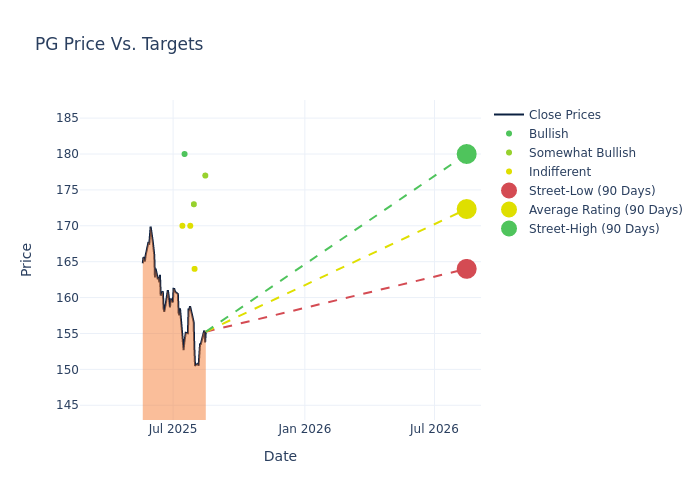
The 12-month price targets, analyzed by analysts, offer insights with an average target of $173.12, a high estimate of $190.00, and a low estimate of $161.00. Observing a downward trend, the current average is 0.86% lower than the prior average price target of $174.62.
Exploring Analyst Ratings: An In-Depth Overview
The standing of Procter & Gamble among financial experts is revealed through an in-depth exploration of recent analyst actions. The summary below outlines key analysts, their recent evaluations, and adjustments to ratings and price targets.
| Analyst | Analyst Firm | Action Taken | Rating | Current Price Target | Prior Price Target |
|---|---|---|---|---|---|
| Kevin Grundy | BNP Paribas | Maintains | Outperform | $177.00 | $177.00 |
| Lauren Lieberman | Barclays | Raises | Equal-Weight | $164.00 | $161.00 |
| Chris Carey | Wells Fargo | Lowers | Overweight | $173.00 | $175.00 |
| Andrea Teixeira | JP Morgan | Lowers | Neutral | $170.00 | $178.00 |
| Peter Grom | UBS | Lowers | Buy | $180.00 | $186.00 |
| Lauren Lieberman | Barclays | Raises | Equal-Weight | $161.00 | $160.00 |
| Robert Ottenstein | Evercore ISI Group | Lowers | In-Line | $170.00 | $190.00 |
| Robert Ottenstein | Evercore ISI Group | Raises | Outperform | $190.00 | $170.00 |
Key Insights:
- Action Taken: Analysts respond to changes in market conditions and company performance, frequently updating their recommendations. Whether they 'Maintain', 'Raise' or 'Lower' their stance, it reflects their reaction to recent developments related to Procter & Gamble. This information offers a snapshot of how analysts perceive the current state of the company.
- Rating: Gaining insights, analysts provide qualitative assessments, ranging from 'Outperform' to 'Underperform'. These ratings reflect expectations for the relative performance of Procter & Gamble compared to the broader market.
- Price Targets: Analysts set price targets as an estimate of a stock's future value. Comparing the current and prior price targets provides insight into how analysts' expectations have changed over time. This information can be valuable for investors seeking to understand consensus views on the stock's potential future performance.
Capture valuable insights into Procter & Gamble's market standing by understanding these analyst evaluations alongside pertinent financial indicators. Stay informed and make strategic decisions with our Ratings Table.
Stay up to date on Procter & Gamble analyst ratings.
All You Need to Know About Procter & Gamble
Since its founding in 1837, Procter & Gamble has become one of the world's largest consumer product manufacturers, with annual sales approaching $85 billion. It operates with a lineup of leading brands, including more than 20 that generate north of $1 billion each in annual global sales, such as Tide laundry detergent, Charmin toilet paper, Pantene shampoo, and Pampers diapers. Sales outside its home turf represent just more than half of the firm's consolidated total.
Breaking Down Procter & Gamble's Financial Performance
Market Capitalization: Boasting an elevated market capitalization, the company surpasses industry averages. This signals substantial size and strong market recognition.
Revenue Growth: Procter & Gamble's revenue growth over a period of 3M has been noteworthy. As of 30 June, 2025, the company achieved a revenue growth rate of approximately 1.74%. This indicates a substantial increase in the company's top-line earnings. When compared to others in the Consumer Staples sector, the company excelled with a growth rate higher than the average among peers.
Net Margin: Procter & Gamble's financial strength is reflected in its exceptional net margin, which exceeds industry averages. With a remarkable net margin of 16.94%, the company showcases strong profitability and effective cost management.
Return on Equity (ROE): Procter & Gamble's ROE lags behind industry averages, suggesting challenges in maximizing returns on equity capital. With an ROE of 6.89%, the company may face hurdles in achieving optimal financial performance.
Return on Assets (ROA): Procter & Gamble's ROA falls below industry averages, indicating challenges in efficiently utilizing assets. With an ROA of 2.85%, the company may face hurdles in generating optimal returns from its assets.
Debt Management: The company maintains a balanced debt approach with a debt-to-equity ratio below industry norms, standing at 0.69.
Analyst Ratings: Simplified
Analysts are specialists within banking and financial systems that typically report for specific stocks or within defined sectors. These people research company financial statements, sit in conference calls and meetings, and speak with relevant insiders to determine what are known as analyst ratings for stocks. Typically, analysts will rate each stock once a quarter.
Analysts may enhance their evaluations by incorporating forecasts for metrics like growth estimates, earnings, and revenue, delivering additional guidance to investors. It is vital to acknowledge that, although experts in stocks and sectors, analysts are human and express their opinions when providing insights.
Which Stocks Are Analysts Recommending Now?
Benzinga Edge gives you instant access to all major analyst upgrades, downgrades, and price targets. Sort by accuracy, upside potential, and more. Click here to stay ahead of the market.
This article was generated by Benzinga's automated content engine and reviewed by an editor.