
Ratings for Golden Entertainment (NASDAQ:GDEN) were provided by 5 analysts in the past three months, showcasing a mix of bullish and bearish perspectives.
In the table below, you'll find a summary of their recent ratings, revealing the shifting sentiments over the past 30 days and comparing them to the previous months.
| Bullish | Somewhat Bullish | Indifferent | Somewhat Bearish | Bearish | |
|---|---|---|---|---|---|
| Total Ratings | 0 | 3 | 2 | 0 | 0 |
| Last 30D | 0 | 1 | 0 | 0 | 0 |
| 1M Ago | 0 | 2 | 2 | 0 | 0 |
| 2M Ago | 0 | 0 | 0 | 0 | 0 |
| 3M Ago | 0 | 0 | 0 | 0 | 0 |
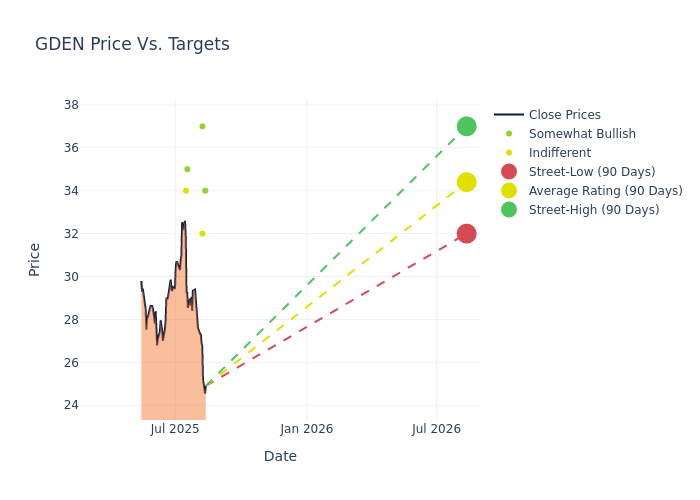
Analysts have set 12-month price targets for Golden Entertainment, revealing an average target of $34.4, a high estimate of $37.00, and a low estimate of $32.00. Experiencing a 5.75% decline, the current average is now lower than the previous average price target of $36.50.
Deciphering Analyst Ratings: An In-Depth Analysis
The standing of Golden Entertainment among financial experts becomes clear with a thorough analysis of recent analyst actions. The summary below outlines key analysts, their recent evaluations, and adjustments to ratings and price targets.
| Analyst | Analyst Firm | Action Taken | Rating | Current Price Target | Prior Price Target |
|---|---|---|---|---|---|
| Zachary Silverberg | Wells Fargo | Lowers | Overweight | $34.00 | $36.00 |
| John DeCree | CBRE | Announces | Hold | $32.00 | - |
| Chad Beynon | Macquarie | Lowers | Outperform | $37.00 | $38.00 |
| Jordan Bender | JMP Securities | Lowers | Market Outperform | $35.00 | $36.00 |
| Barry Jonas | Truist Securities | Lowers | Hold | $34.00 | $36.00 |
Key Insights:
- Action Taken: In response to dynamic market conditions and company performance, analysts update their recommendations. Whether they 'Maintain', 'Raise', or 'Lower' their stance, it signifies their reaction to recent developments related to Golden Entertainment. This insight gives a snapshot of analysts' perspectives on the current state of the company.
- Rating: Offering a comprehensive view, analysts assess stocks qualitatively, spanning from 'Outperform' to 'Underperform'. These ratings convey expectations for the relative performance of Golden Entertainment compared to the broader market.
- Price Targets: Analysts provide insights into price targets, offering estimates for the future value of Golden Entertainment's stock. This comparison reveals trends in analysts' expectations over time.
Analyzing these analyst evaluations alongside relevant financial metrics can provide a comprehensive view of Golden Entertainment's market position. Stay informed and make data-driven decisions with the assistance of our Ratings Table.
Stay up to date on Golden Entertainment analyst ratings.
If you are interested in following small-cap stock news and performance you can start by tracking it here.
Get to Know Golden Entertainment Better
Golden Entertainment Inc is a U.S. based company that focuses on distributed gaming, casino, and resort operations. Its reportable segments are Nevada Casino Resorts, Nevada Locals Casinos, Nevada Taverns, and Distributed Gaming. The majority of the revenue for the company is generated from its Nevada Casino Resorts segment which is comprised of destination casino resort properties offering a variety of food and beverage outlets, entertainment venues, and other amenities.
Golden Entertainment: Financial Performance Dissected
Market Capitalization: With restricted market capitalization, the company is positioned below industry averages. This reflects a smaller scale relative to peers.
Revenue Challenges: Golden Entertainment's revenue growth over 3M faced difficulties. As of 30 June, 2025, the company experienced a decline of approximately -2.22%. This indicates a decrease in top-line earnings. When compared to others in the Consumer Discretionary sector, the company faces challenges, achieving a growth rate lower than the average among peers.
Net Margin: Golden Entertainment's net margin is below industry averages, indicating potential challenges in maintaining strong profitability. With a net margin of 2.83%, the company may face hurdles in effective cost management.
Return on Equity (ROE): The company's ROE is below industry benchmarks, signaling potential difficulties in efficiently using equity capital. With an ROE of 1.02%, the company may need to address challenges in generating satisfactory returns for shareholders.
Return on Assets (ROA): Golden Entertainment's ROA is below industry standards, pointing towards difficulties in efficiently utilizing assets. With an ROA of 0.44%, the company may encounter challenges in delivering satisfactory returns from its assets.
Debt Management: Golden Entertainment's debt-to-equity ratio is below industry norms, indicating a sound financial structure with a ratio of 1.16.
How Are Analyst Ratings Determined?
Analysts work in banking and financial systems and typically specialize in reporting for stocks or defined sectors. Analysts may attend company conference calls and meetings, research company financial statements, and communicate with insiders to publish "analyst ratings" for stocks. Analysts typically rate each stock once per quarter.
Some analysts publish their predictions for metrics such as growth estimates, earnings, and revenue to provide additional guidance with their ratings. When using analyst ratings, it is important to keep in mind that stock and sector analysts are also human and are only offering their opinions to investors.
If you want to keep track of which analysts are outperforming others, you can view updated analyst ratings along withanalyst success scores in Benzinga Pro.
Which Stocks Are Analysts Recommending Now?
Benzinga Edge gives you instant access to all major analyst upgrades, downgrades, and price targets. Sort by accuracy, upside potential, and more. Click here to stay ahead of the market.
This article was generated by Benzinga's automated content engine and reviewed by an editor.