
Across the recent three months, 3 analysts have shared their insights on Asbury Automotive Group (NYSE:ABG), expressing a variety of opinions spanning from bullish to bearish.
The table below summarizes their recent ratings, showcasing the evolving sentiments within the past 30 days and comparing them to the preceding months.
| Bullish | Somewhat Bullish | Indifferent | Somewhat Bearish | Bearish | |
|---|---|---|---|---|---|
| Total Ratings | 1 | 0 | 0 | 2 | 0 |
| Last 30D | 0 | 0 | 0 | 1 | 0 |
| 1M Ago | 0 | 0 | 0 | 1 | 0 |
| 2M Ago | 1 | 0 | 0 | 0 | 0 |
| 3M Ago | 0 | 0 | 0 | 0 | 0 |
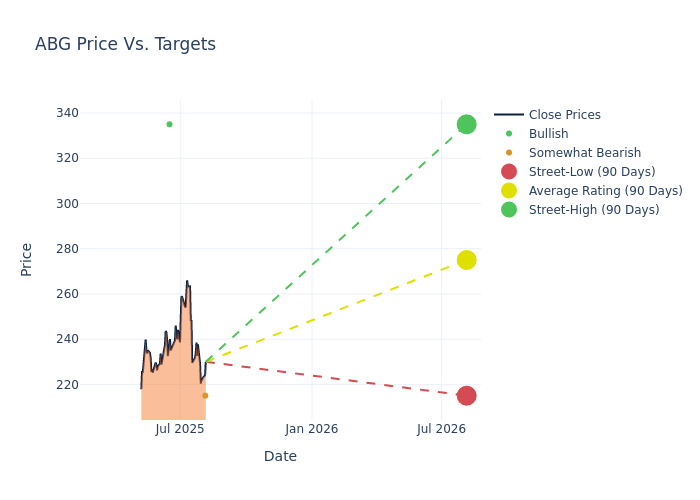
The 12-month price targets, analyzed by analysts, offer insights with an average target of $258.33, a high estimate of $335.00, and a low estimate of $215.00. This current average represents a 1.28% decrease from the previous average price target of $261.67.
Investigating Analyst Ratings: An Elaborate Study
In examining recent analyst actions, we gain insights into how financial experts perceive Asbury Automotive Group. The following summary outlines key analysts, their recent evaluations, and adjustments to ratings and price targets.
| Analyst | Analyst Firm | Action Taken | Rating | Current Price Target | Prior Price Target |
|---|---|---|---|---|---|
| Rajat Gupta | JP Morgan | Lowers | Underweight | $215.00 | $225.00 |
| Rajat Gupta | JP Morgan | Lowers | Underweight | $225.00 | $235.00 |
| John Murphy | B of A Securities | Raises | Buy | $335.00 | $325.00 |
Key Insights:
- Action Taken: Analysts adapt their recommendations to changing market conditions and company performance. Whether they 'Maintain', 'Raise' or 'Lower' their stance, it reflects their response to recent developments related to Asbury Automotive Group. This information provides a snapshot of how analysts perceive the current state of the company.
- Rating: Providing a comprehensive analysis, analysts offer qualitative assessments, ranging from 'Outperform' to 'Underperform'. These ratings reflect expectations for the relative performance of Asbury Automotive Group compared to the broader market.
- Price Targets: Analysts set price targets as an estimate of a stock's future value. Comparing the current and prior price targets provides insight into how analysts' expectations have changed over time. This information can be valuable for investors seeking to understand consensus views on the stock's potential future performance.
Assessing these analyst evaluations alongside crucial financial indicators can provide a comprehensive overview of Asbury Automotive Group's market position. Stay informed and make well-judged decisions with the assistance of our Ratings Table.
Stay up to date on Asbury Automotive Group analyst ratings.
Get to Know Asbury Automotive Group Better
Asbury Automotive Group is a regional collection of automobile dealerships that went public in March 2002. The company operates 152 new-vehicle stores and 37 collision centers. Over 70% of new-vehicle revenue is from luxury and import brands. Asbury also offers third-party financing and insurance products and its own F&I products via Total Care Auto. Asbury operates in 14 states (mostly Texas, the West, the Mid-Atlantic, and the Southeast). Asbury store brands include McDavid and Park Place in Texas, Koons in the Washington, D.C. area, and the Larry H. Miller brand in the Western US. Asbury generated $17.2 billion of revenue in 2024 and is based in the Atlanta area. The firm targets at least $30 billion of revenue sometime around 2030.
Asbury Automotive Group's Economic Impact: An Analysis
Market Capitalization Analysis: Positioned below industry benchmarks, the company's market capitalization faces constraints in size. This could be influenced by factors such as growth expectations or operational capacity.
Revenue Growth: Asbury Automotive Group's revenue growth over a period of 3M has been noteworthy. As of 30 June, 2025, the company achieved a revenue growth rate of approximately 2.99%. This indicates a substantial increase in the company's top-line earnings. When compared to others in the Consumer Discretionary sector, the company excelled with a growth rate higher than the average among peers.
Net Margin: Asbury Automotive Group's net margin surpasses industry standards, highlighting the company's exceptional financial performance. With an impressive 3.49% net margin, the company effectively manages costs and achieves strong profitability.
Return on Equity (ROE): Asbury Automotive Group's ROE stands out, surpassing industry averages. With an impressive ROE of 4.13%, the company demonstrates effective use of equity capital and strong financial performance.
Return on Assets (ROA): Asbury Automotive Group's ROA stands out, surpassing industry averages. With an impressive ROA of 1.5%, the company demonstrates effective utilization of assets and strong financial performance.
Debt Management: Asbury Automotive Group's debt-to-equity ratio is below the industry average. With a ratio of 1.21, the company relies less on debt financing, maintaining a healthier balance between debt and equity, which can be viewed positively by investors.
Analyst Ratings: Simplified
Experts in banking and financial systems, analysts specialize in reporting for specific stocks or defined sectors. Their comprehensive research involves attending company conference calls and meetings, analyzing financial statements, and engaging with insiders to generate what are known as analyst ratings for stocks. Typically, analysts assess and rate each stock once per quarter.
Beyond their standard evaluations, some analysts contribute predictions for metrics like growth estimates, earnings, and revenue, furnishing investors with additional guidance. Users of analyst ratings should be mindful that this specialized advice is shaped by human perspectives and may be subject to variability.
Breaking: Wall Street's Next Big Mover
Benzinga's #1 analyst just identified a stock poised for explosive growth. This under-the-radar company could surge 200%+ as major market shifts unfold. Click here for urgent details.
This article was generated by Benzinga's automated content engine and reviewed by an editor.