
GrafTech International Ltd. (NYSE:EAF) shares have continued their recent momentum with a 39% gain in the last month alone. Looking back a bit further, it's encouraging to see the stock is up 98% in the last year.
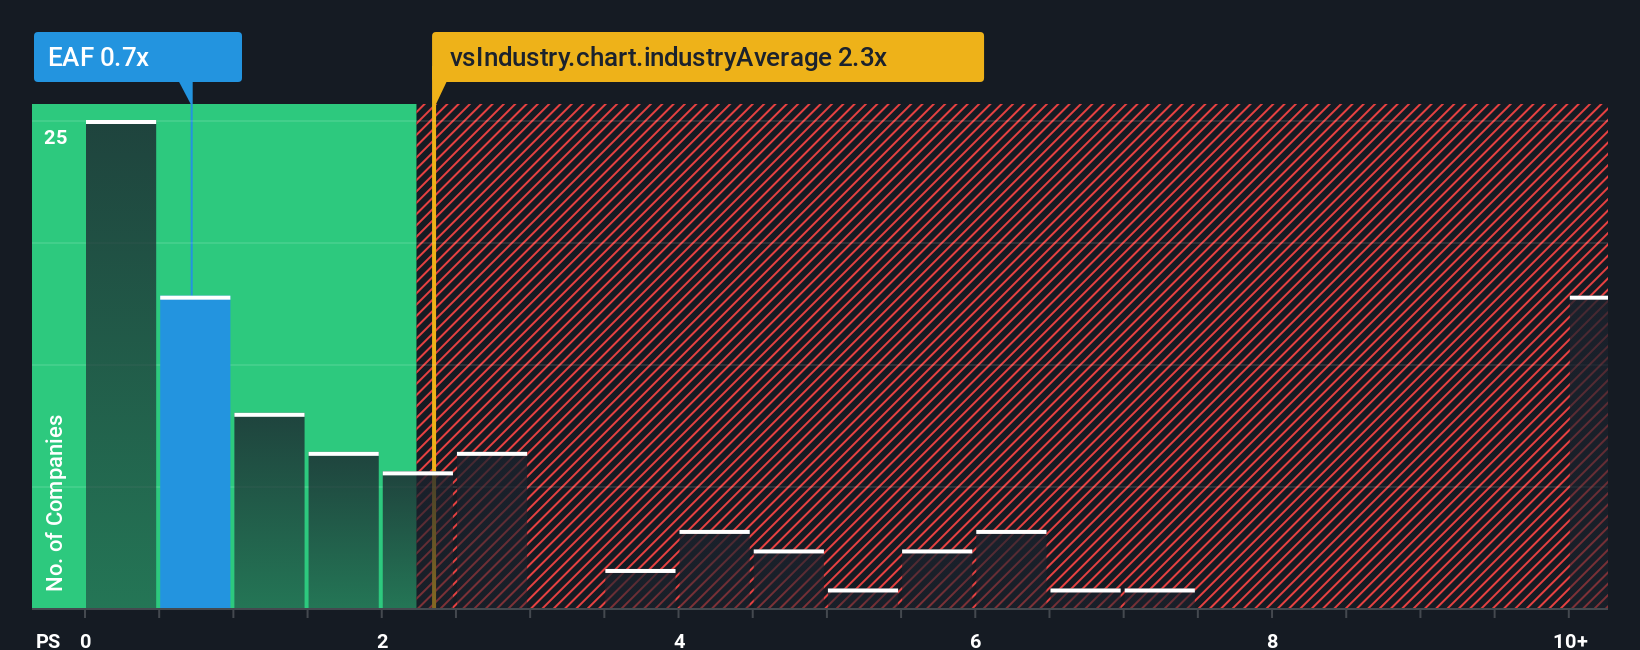
Even after such a large jump in price, GrafTech International may still be sending bullish signals at the moment with its price-to-sales (or "P/S") ratio of 0.7x, since almost half of all companies in the Electrical industry in the United States have P/S ratios greater than 2.3x and even P/S higher than 7x are not unusual. Although, it's not wise to just take the P/S at face value as there may be an explanation why it's limited.
Check out our latest analysis for GrafTech International
What Does GrafTech International's P/S Mean For Shareholders?
GrafTech International could be doing better as its revenue has been going backwards lately while most other companies have been seeing positive revenue growth. The P/S ratio is probably low because investors think this poor revenue performance isn't going to get any better. So while you could say the stock is cheap, investors will be looking for improvement before they see it as good value.
Keen to find out how analysts think GrafTech International's future stacks up against the industry? In that case, our free report is a great place to start.Is There Any Revenue Growth Forecasted For GrafTech International?
The only time you'd be truly comfortable seeing a P/S as low as GrafTech International's is when the company's growth is on track to lag the industry.
Retrospectively, the last year delivered a frustrating 11% decrease to the company's top line. As a result, revenue from three years ago have also fallen 65% overall. Therefore, it's fair to say the revenue growth recently has been undesirable for the company.
Looking ahead now, revenue is anticipated to climb by 17% during the coming year according to the three analysts following the company. Meanwhile, the rest of the industry is forecast to only expand by 12%, which is noticeably less attractive.
With this in consideration, we find it intriguing that GrafTech International's P/S sits behind most of its industry peers. Apparently some shareholders are doubtful of the forecasts and have been accepting significantly lower selling prices.
The Key Takeaway
The latest share price surge wasn't enough to lift GrafTech International's P/S close to the industry median. Using the price-to-sales ratio alone to determine if you should sell your stock isn't sensible, however it can be a practical guide to the company's future prospects.
To us, it seems GrafTech International currently trades on a significantly depressed P/S given its forecasted revenue growth is higher than the rest of its industry. There could be some major risk factors that are placing downward pressure on the P/S ratio. It appears the market could be anticipating revenue instability, because these conditions should normally provide a boost to the share price.
Having said that, be aware GrafTech International is showing 3 warning signs in our investment analysis, you should know about.
If you're unsure about the strength of GrafTech International's business, why not explore our interactive list of stocks with solid business fundamentals for some other companies you may have missed.
Have feedback on this article? Concerned about the content? Get in touch with us directly. Alternatively, email editorial-team (at) simplywallst.com.
This article by Simply Wall St is general in nature. We provide commentary based on historical data and analyst forecasts only using an unbiased methodology and our articles are not intended to be financial advice. It does not constitute a recommendation to buy or sell any stock, and does not take account of your objectives, or your financial situation. We aim to bring you long-term focused analysis driven by fundamental data. Note that our analysis may not factor in the latest price-sensitive company announcements or qualitative material. Simply Wall St has no position in any stocks mentioned.