
RE/MAX Holdings, Inc. (NYSE:RMAX) shareholders should be happy to see the share price up 21% in the last month. But don't envy holders -- looking back over 5 years the returns have been really bad. Indeed, the share price is down 72% in the period. So we're hesitant to put much weight behind the short term increase. Of course, this could be the start of a turnaround.
While the last five years has been tough for RE/MAX Holdings shareholders, this past week has shown signs of promise. So let's look at the longer term fundamentals and see if they've been the driver of the negative returns.
While markets are a powerful pricing mechanism, share prices reflect investor sentiment, not just underlying business performance. One imperfect but simple way to consider how the market perception of a company has shifted is to compare the change in the earnings per share (EPS) with the share price movement.
During five years of share price growth, RE/MAX Holdings moved from a loss to profitability. That would generally be considered a positive, so we are surprised to see the share price is down. Other metrics might give us a better handle on how its value is changing over time.
Revenue is actually up 3.2% over the time period. So it seems one might have to take closer look at the fundamentals to understand why the share price languishes. After all, there may be an opportunity.
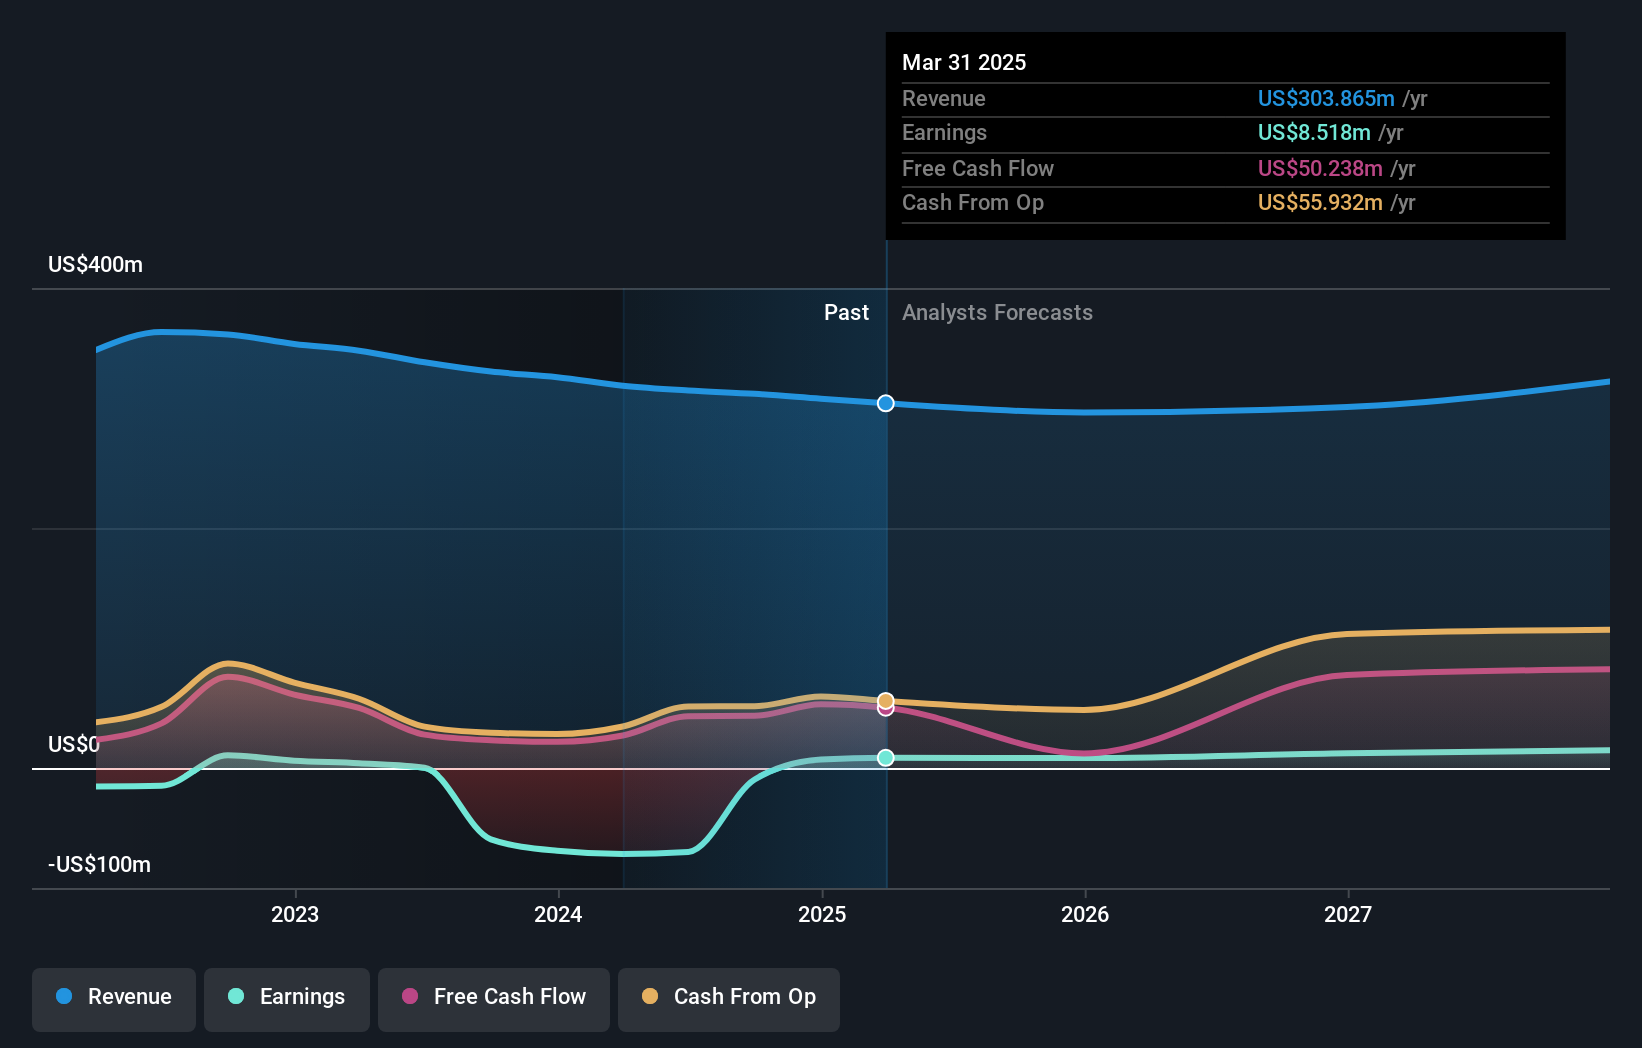
The image below shows how earnings and revenue have tracked over time (if you click on the image you can see greater detail).
We know that RE/MAX Holdings has improved its bottom line lately, but what does the future have in store? This free report showing analyst forecasts should help you form a view on RE/MAX Holdings
What About The Total Shareholder Return (TSR)?
Investors should note that there's a difference between RE/MAX Holdings' total shareholder return (TSR) and its share price change, which we've covered above. Arguably the TSR is a more complete return calculation because it accounts for the value of dividends (as if they were reinvested), along with the hypothetical value of any discounted capital that have been offered to shareholders. Its history of dividend payouts mean that RE/MAX Holdings' TSR, which was a 69% drop over the last 5 years, was not as bad as the share price return.
A Different Perspective
RE/MAX Holdings shareholders gained a total return of 8.4% during the year. Unfortunately this falls short of the market return. On the bright side, that's still a gain, and it is certainly better than the yearly loss of about 11% endured over half a decade. So this might be a sign the business has turned its fortunes around. I find it very interesting to look at share price over the long term as a proxy for business performance. But to truly gain insight, we need to consider other information, too. Even so, be aware that RE/MAX Holdings is showing 4 warning signs in our investment analysis , and 2 of those don't sit too well with us...
But note: RE/MAX Holdings may not be the best stock to buy. So take a peek at this free list of interesting companies with past earnings growth (and further growth forecast).
Please note, the market returns quoted in this article reflect the market weighted average returns of stocks that currently trade on American exchanges.
Have feedback on this article? Concerned about the content? Get in touch with us directly. Alternatively, email editorial-team (at) simplywallst.com.
This article by Simply Wall St is general in nature. We provide commentary based on historical data and analyst forecasts only using an unbiased methodology and our articles are not intended to be financial advice. It does not constitute a recommendation to buy or sell any stock, and does not take account of your objectives, or your financial situation. We aim to bring you long-term focused analysis driven by fundamental data. Note that our analysis may not factor in the latest price-sensitive company announcements or qualitative material. Simply Wall St has no position in any stocks mentioned.