
We think all investors should try to buy and hold high quality multi-year winners. And we've seen some truly amazing gains over the years. Don't believe it? Then look at the Penske Automotive Group, Inc. (NYSE:PAG) share price. It's 350% higher than it was five years ago. And this is just one example of the epic gains achieved by some long term investors. It's also good to see the share price up 13% over the last quarter.
With that in mind, it's worth seeing if the company's underlying fundamentals have been the driver of long term performance, or if there are some discrepancies.
While markets are a powerful pricing mechanism, share prices reflect investor sentiment, not just underlying business performance. One imperfect but simple way to consider how the market perception of a company has shifted is to compare the change in the earnings per share (EPS) with the share price movement.
During five years of share price growth, Penske Automotive Group achieved compound earnings per share (EPS) growth of 25% per year. This EPS growth is slower than the share price growth of 35% per year, over the same period. So it's fair to assume the market has a higher opinion of the business than it did five years ago. That's not necessarily surprising considering the five-year track record of earnings growth.
The graphic below depicts how EPS has changed over time (unveil the exact values by clicking on the image).
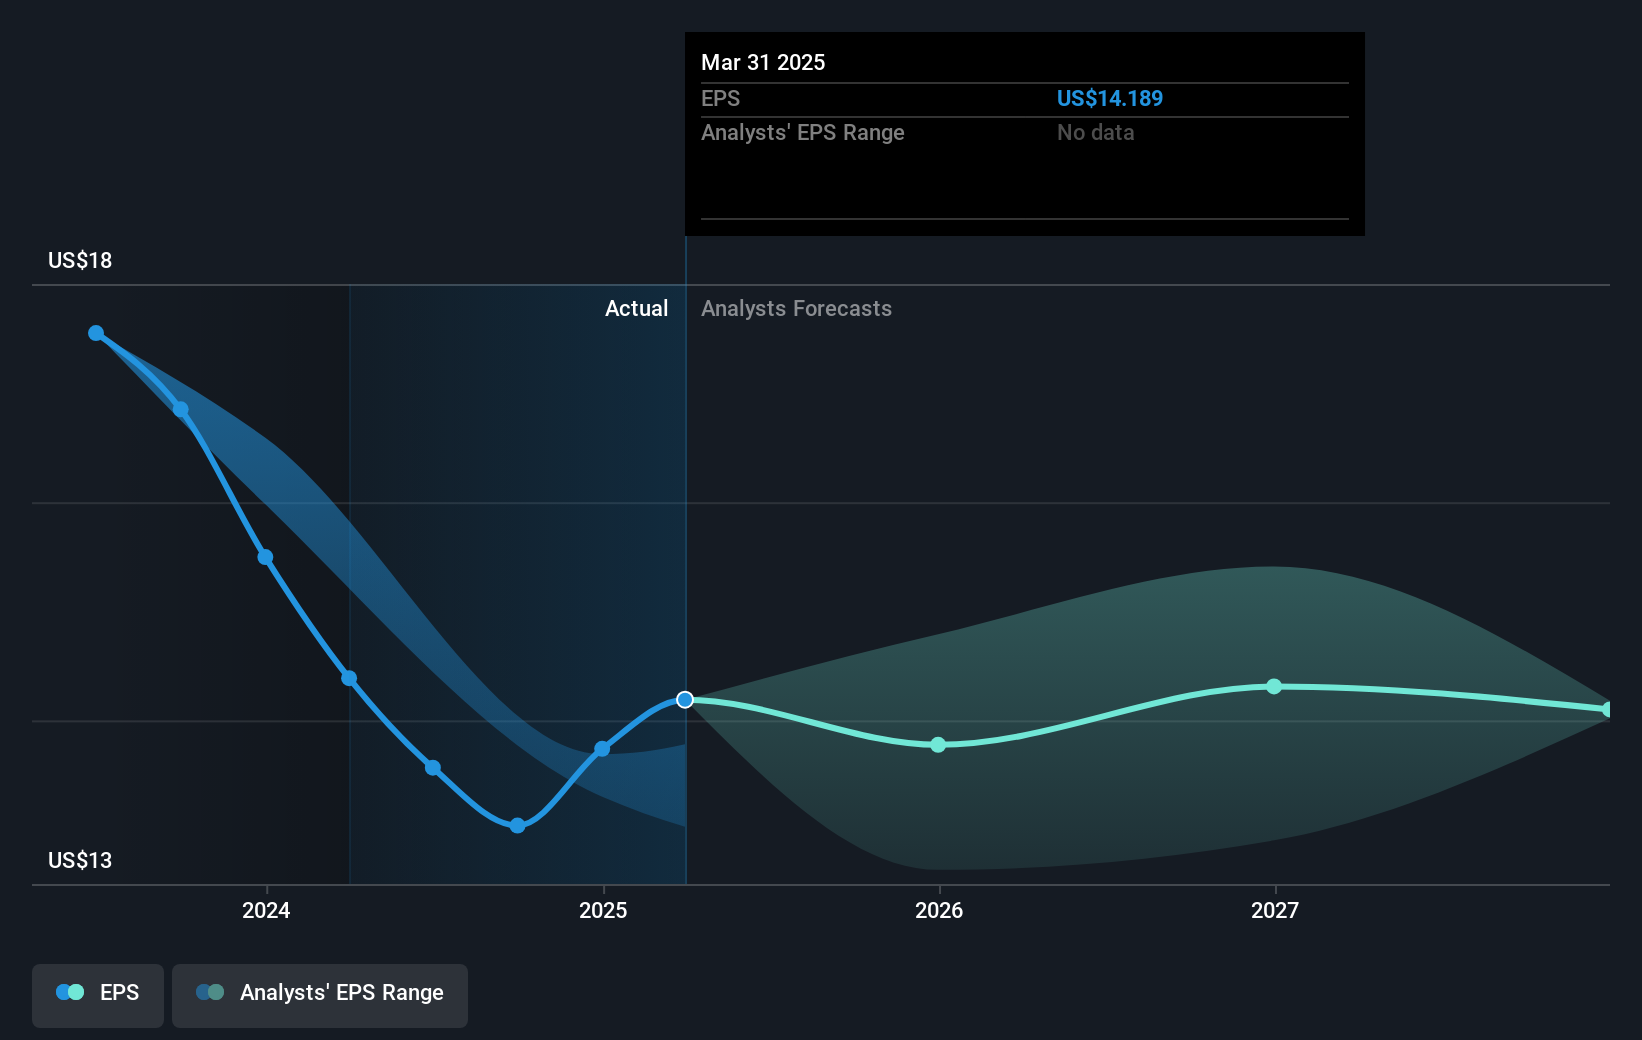
It might be well worthwhile taking a look at our free report on Penske Automotive Group's earnings, revenue and cash flow.
What About Dividends?
It is important to consider the total shareholder return, as well as the share price return, for any given stock. Whereas the share price return only reflects the change in the share price, the TSR includes the value of dividends (assuming they were reinvested) and the benefit of any discounted capital raising or spin-off. Arguably, the TSR gives a more comprehensive picture of the return generated by a stock. In the case of Penske Automotive Group, it has a TSR of 401% for the last 5 years. That exceeds its share price return that we previously mentioned. And there's no prize for guessing that the dividend payments largely explain the divergence!
A Different Perspective
We're pleased to report that Penske Automotive Group shareholders have received a total shareholder return of 19% over one year. That's including the dividend. Having said that, the five-year TSR of 38% a year, is even better. Potential buyers might understandably feel they've missed the opportunity, but it's always possible business is still firing on all cylinders. I find it very interesting to look at share price over the long term as a proxy for business performance. But to truly gain insight, we need to consider other information, too. Even so, be aware that Penske Automotive Group is showing 3 warning signs in our investment analysis , and 1 of those doesn't sit too well with us...
If you like to buy stocks alongside management, then you might just love this free list of companies. (Hint: many of them are unnoticed AND have attractive valuation).
Please note, the market returns quoted in this article reflect the market weighted average returns of stocks that currently trade on American exchanges.
Have feedback on this article? Concerned about the content? Get in touch with us directly. Alternatively, email editorial-team (at) simplywallst.com.
This article by Simply Wall St is general in nature. We provide commentary based on historical data and analyst forecasts only using an unbiased methodology and our articles are not intended to be financial advice. It does not constitute a recommendation to buy or sell any stock, and does not take account of your objectives, or your financial situation. We aim to bring you long-term focused analysis driven by fundamental data. Note that our analysis may not factor in the latest price-sensitive company announcements or qualitative material. Simply Wall St has no position in any stocks mentioned.