
When you buy shares in a company, it's worth keeping in mind the possibility that it could fail, and you could lose your money. But on a lighter note, a good company can see its share price rise well over 100%. For example, the Martin Marietta Materials, Inc. (NYSE:MLM) share price has soared 165% in the last half decade. Most would be very happy with that. It's also good to see the share price up 13% over the last quarter. But this could be related to the strong market, which is up 5.3% in the last three months.
So let's assess the underlying fundamentals over the last 5 years and see if they've moved in lock-step with shareholder returns.
To paraphrase Benjamin Graham: Over the short term the market is a voting machine, but over the long term it's a weighing machine. By comparing earnings per share (EPS) and share price changes over time, we can get a feel for how investor attitudes to a company have morphed over time.
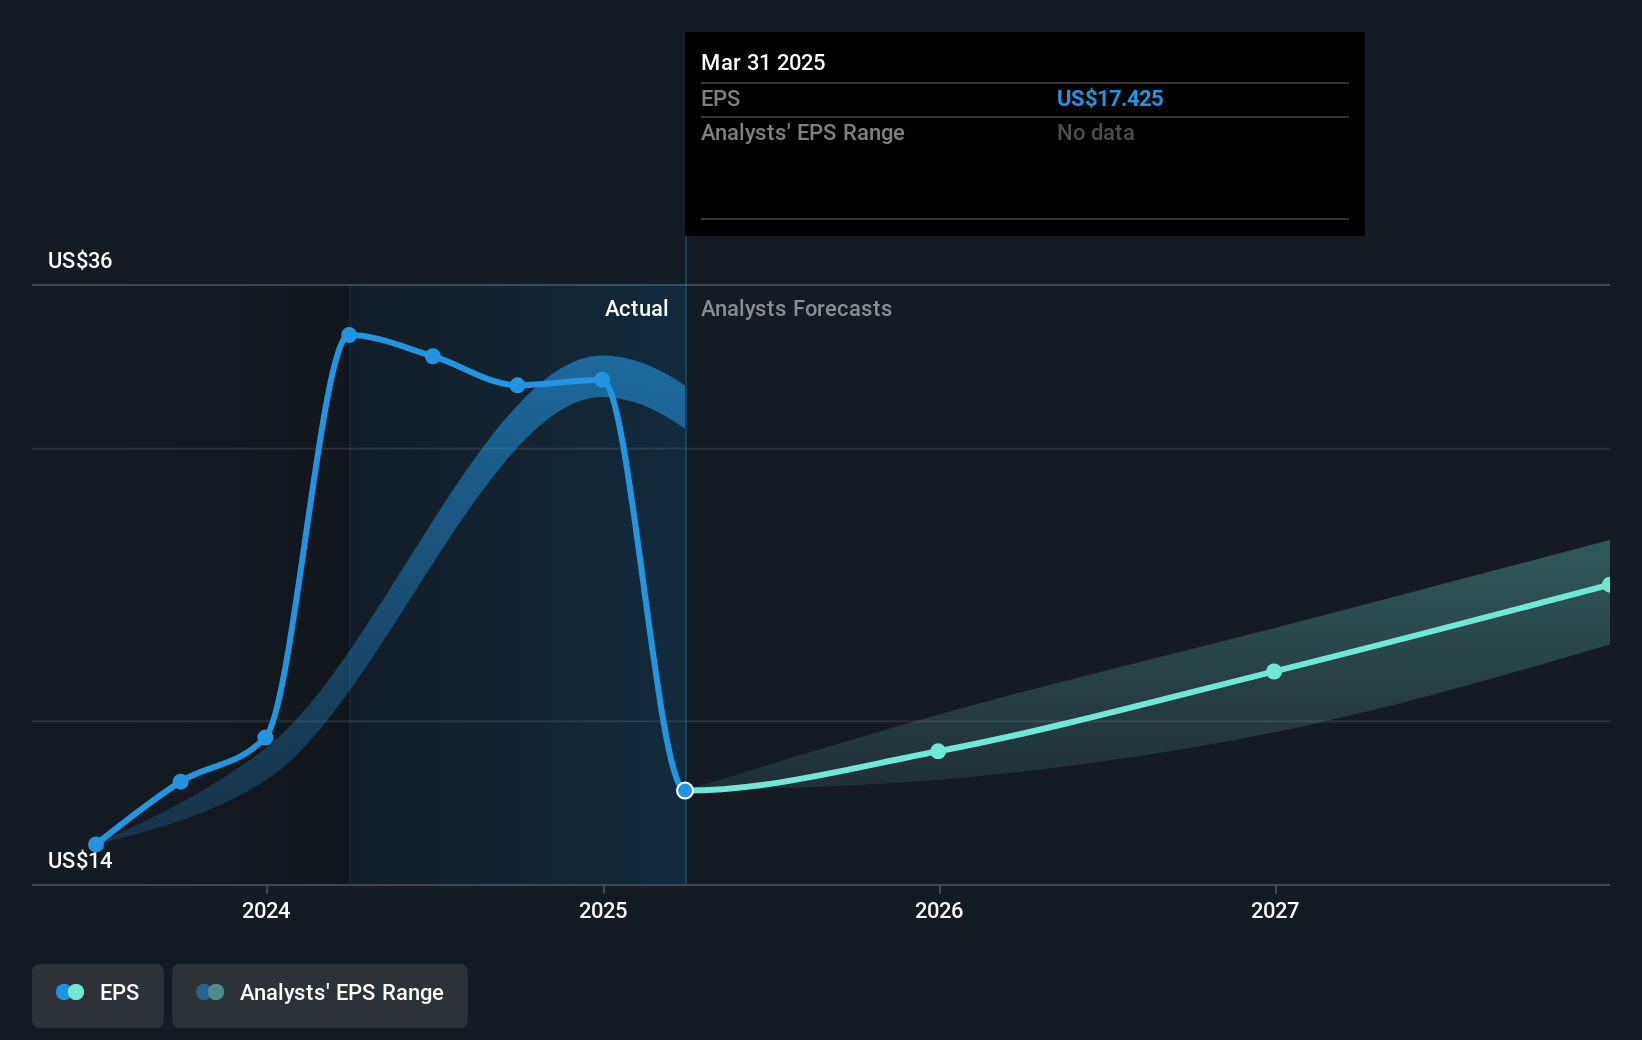
Over half a decade, Martin Marietta Materials managed to grow its earnings per share at 13% a year. This EPS growth is slower than the share price growth of 22% per year, over the same period. This suggests that market participants hold the company in higher regard, these days. And that's hardly shocking given the track record of growth.
The image below shows how EPS has tracked over time (if you click on the image you can see greater detail).
We like that insiders have been buying shares in the last twelve months. Having said that, most people consider earnings and revenue growth trends to be a more meaningful guide to the business. It might be well worthwhile taking a look at our free report on Martin Marietta Materials' earnings, revenue and cash flow.
What About Dividends?
When looking at investment returns, it is important to consider the difference between total shareholder return (TSR) and share price return. Whereas the share price return only reflects the change in the share price, the TSR includes the value of dividends (assuming they were reinvested) and the benefit of any discounted capital raising or spin-off. So for companies that pay a generous dividend, the TSR is often a lot higher than the share price return. We note that for Martin Marietta Materials the TSR over the last 5 years was 174%, which is better than the share price return mentioned above. And there's no prize for guessing that the dividend payments largely explain the divergence!
A Different Perspective
Investors in Martin Marietta Materials had a tough year, with a total loss of 0.5% (including dividends), against a market gain of about 12%. However, keep in mind that even the best stocks will sometimes underperform the market over a twelve month period. Longer term investors wouldn't be so upset, since they would have made 22%, each year, over five years. It could be that the recent sell-off is an opportunity, so it may be worth checking the fundamental data for signs of a long term growth trend. I find it very interesting to look at share price over the long term as a proxy for business performance. But to truly gain insight, we need to consider other information, too. To that end, you should be aware of the 2 warning signs we've spotted with Martin Marietta Materials .
There are plenty of other companies that have insiders buying up shares. You probably do not want to miss this free list of undervalued small cap companies that insiders are buying.
Please note, the market returns quoted in this article reflect the market weighted average returns of stocks that currently trade on American exchanges.
Have feedback on this article? Concerned about the content? Get in touch with us directly. Alternatively, email editorial-team (at) simplywallst.com.
This article by Simply Wall St is general in nature. We provide commentary based on historical data and analyst forecasts only using an unbiased methodology and our articles are not intended to be financial advice. It does not constitute a recommendation to buy or sell any stock, and does not take account of your objectives, or your financial situation. We aim to bring you long-term focused analysis driven by fundamental data. Note that our analysis may not factor in the latest price-sensitive company announcements or qualitative material. Simply Wall St has no position in any stocks mentioned.