
6 analysts have expressed a variety of opinions on Steel Dynamics (NASDAQ:STLD) over the past quarter, offering a diverse set of opinions from bullish to bearish.
The table below provides a concise overview of recent ratings by analysts, offering insights into the changing sentiments over the past 30 days and drawing comparisons with the preceding months for a holistic perspective.
| Bullish | Somewhat Bullish | Indifferent | Somewhat Bearish | Bearish | |
|---|---|---|---|---|---|
| Total Ratings | 1 | 3 | 2 | 0 | 0 |
| Last 30D | 0 | 1 | 0 | 0 | 0 |
| 1M Ago | 0 | 0 | 0 | 0 | 0 |
| 2M Ago | 0 | 1 | 1 | 0 | 0 |
| 3M Ago | 1 | 1 | 1 | 0 | 0 |
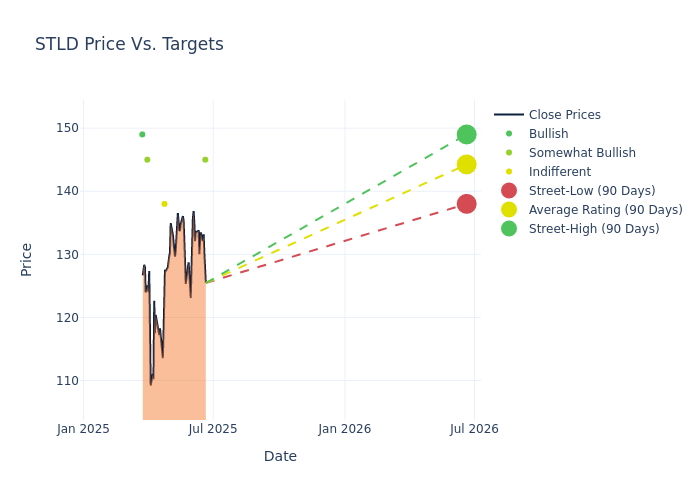
Analysts have set 12-month price targets for Steel Dynamics, revealing an average target of $142.0, a high estimate of $149.00, and a low estimate of $135.00. Observing a 2.16% increase, the current average has risen from the previous average price target of $139.00.
Analyzing Analyst Ratings: A Detailed Breakdown
The standing of Steel Dynamics among financial experts becomes clear with a thorough analysis of recent analyst actions. The summary below outlines key analysts, their recent evaluations, and adjustments to ratings and price targets.
| Analyst | Analyst Firm | Action Taken | Rating | Current Price Target | Prior Price Target |
|---|---|---|---|---|---|
| Carlos De Alba | Morgan Stanley | Raises | Overweight | $145.00 | $140.00 |
| Carlos De Alba | Morgan Stanley | Lowers | Overweight | $140.00 | $145.00 |
| Bill Peterson | JP Morgan | Raises | Neutral | $138.00 | $135.00 |
| Bill Peterson | JP Morgan | Lowers | Neutral | $135.00 | $140.00 |
| Katja Jancic | BMO Capital | Raises | Outperform | $145.00 | $135.00 |
| Andrew Jones | UBS | Announces | Buy | $149.00 | - |
Key Insights:
- Action Taken: Analysts frequently update their recommendations based on evolving market conditions and company performance. Whether they 'Maintain', 'Raise' or 'Lower' their stance, it reflects their reaction to recent developments related to Steel Dynamics. This information provides a snapshot of how analysts perceive the current state of the company.
- Rating: Offering insights into predictions, analysts assign qualitative values, from 'Outperform' to 'Underperform'. These ratings convey expectations for the relative performance of Steel Dynamics compared to the broader market.
- Price Targets: Analysts explore the dynamics of price targets, providing estimates for the future value of Steel Dynamics's stock. This examination reveals shifts in analysts' expectations over time.
Understanding these analyst evaluations alongside key financial indicators can offer valuable insights into Steel Dynamics's market standing. Stay informed and make well-considered decisions with our Ratings Table.
Stay up to date on Steel Dynamics analyst ratings.
Unveiling the Story Behind Steel Dynamics
Steel Dynamics Inc operates as a domestic steel producer and metal recycler in the United States. The company's product portfolio comprises hot rolled sheet, hot rolled plate, painted sheet products, cold rolled sheet, and others. Its reportable segments are steel operations, metals recycling operations, steel fabrication operations, and aluminum operations. Maximum revenue is generated from its steel operations segment, which consists of manufacturing various steel products and numerous coating operations. Its primary sources of revenue are currently from the manufacture and sale of steel products, the processing and sale of recycled ferrous and nonferrous metals, and the fabrication and sale of steel joists and deck products.
A Deep Dive into Steel Dynamics's Financials
Market Capitalization Highlights: Above the industry average, the company's market capitalization signifies a significant scale, indicating strong confidence and market prominence.
Revenue Growth: Steel Dynamics's revenue growth over a period of 3M has faced challenges. As of 31 March, 2025, the company experienced a revenue decline of approximately -6.92%. This indicates a decrease in the company's top-line earnings. In comparison to its industry peers, the company stands out with a growth rate higher than the average among peers in the Materials sector.
Net Margin: The company's net margin is a standout performer, exceeding industry averages. With an impressive net margin of 4.97%, the company showcases strong profitability and effective cost control.
Return on Equity (ROE): Steel Dynamics's ROE excels beyond industry benchmarks, reaching 2.45%. This signifies robust financial management and efficient use of shareholder equity capital.
Return on Assets (ROA): Steel Dynamics's ROA surpasses industry standards, highlighting the company's exceptional financial performance. With an impressive 1.41% ROA, the company effectively utilizes its assets for optimal returns.
Debt Management: The company maintains a balanced debt approach with a debt-to-equity ratio below industry norms, standing at 0.48.
Analyst Ratings: What Are They?
Ratings come from analysts, or specialists within banking and financial systems that report for specific stocks or defined sectors (typically once per quarter for each stock). Analysts usually derive their information from company conference calls and meetings, financial statements, and conversations with important insiders to reach their decisions.
Some analysts publish their predictions for metrics such as growth estimates, earnings, and revenue to provide additional guidance with their ratings. When using analyst ratings, it is important to keep in mind that stock and sector analysts are also human and are only offering their opinions to investors.
Breaking: Wall Street's Next Big Mover
Benzinga's #1 analyst just identified a stock poised for explosive growth. This under-the-radar company could surge 200%+ as major market shifts unfold. Click here for urgent details.
This article was generated by Benzinga's automated content engine and reviewed by an editor.