
7 analysts have shared their evaluations of Cactus (NYSE:WHD) during the recent three months, expressing a mix of bullish and bearish perspectives.
The following table encapsulates their recent ratings, offering a glimpse into the evolving sentiments over the past 30 days and comparing them to the preceding months.
| Bullish | Somewhat Bullish | Indifferent | Somewhat Bearish | Bearish | |
|---|---|---|---|---|---|
| Total Ratings | 2 | 2 | 3 | 0 | 0 |
| Last 30D | 0 | 1 | 0 | 0 | 0 |
| 1M Ago | 0 | 1 | 1 | 0 | 0 |
| 2M Ago | 1 | 0 | 2 | 0 | 0 |
| 3M Ago | 1 | 0 | 0 | 0 | 0 |
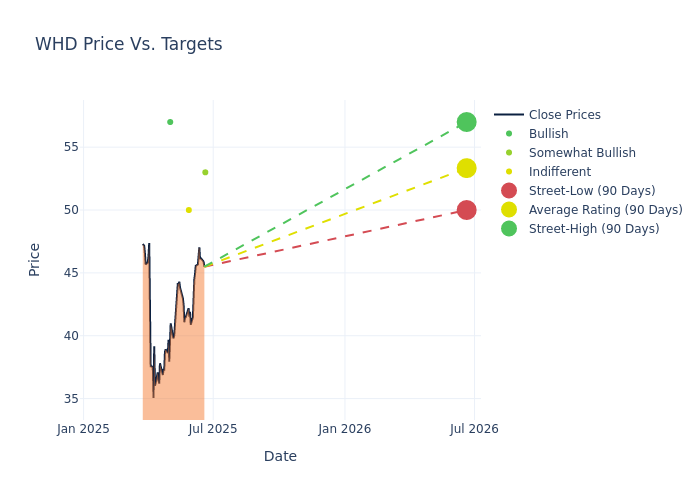
Insights from analysts' 12-month price targets are revealed, presenting an average target of $54.0, a high estimate of $61.00, and a low estimate of $50.00. Observing a downward trend, the current average is 3.07% lower than the prior average price target of $55.71.
Investigating Analyst Ratings: An Elaborate Study
The perception of Cactus by financial experts is analyzed through recent analyst actions. The following summary presents key analysts, their recent evaluations, and adjustments to ratings and price targets.
| Analyst | Analyst Firm | Action Taken | Rating | Current Price Target | Prior Price Target |
|---|---|---|---|---|---|
| David Anderson | Barclays | Lowers | Overweight | $53.00 | $54.00 |
| David Anderson | Barclays | Raises | Overweight | $54.00 | $51.00 |
| Arun Jayaram | JP Morgan | Lowers | Neutral | $50.00 | $52.00 |
| Arun Jayaram | JP Morgan | Lowers | Neutral | $52.00 | $54.00 |
| David Anderson | Barclays | Lowers | Equal-Weight | $51.00 | $54.00 |
| Stephen Gengaro | Stifel | Lowers | Buy | $57.00 | $61.00 |
| Stephen Gengaro | Stifel | Lowers | Buy | $61.00 | $64.00 |
Key Insights:
- Action Taken: Analysts respond to changes in market conditions and company performance, frequently updating their recommendations. Whether they 'Maintain', 'Raise' or 'Lower' their stance, it reflects their reaction to recent developments related to Cactus. This information offers a snapshot of how analysts perceive the current state of the company.
- Rating: Offering insights into predictions, analysts assign qualitative values, from 'Outperform' to 'Underperform'. These ratings convey expectations for the relative performance of Cactus compared to the broader market.
- Price Targets: Analysts provide insights into price targets, offering estimates for the future value of Cactus's stock. This comparison reveals trends in analysts' expectations over time.
Analyzing these analyst evaluations alongside relevant financial metrics can provide a comprehensive view of Cactus's market position. Stay informed and make data-driven decisions with the assistance of our Ratings Table.
Stay up to date on Cactus analyst ratings.
Discovering Cactus: A Closer Look
Cactus Inc is engaged in the designing, manufacturing, and sale of wellheads and pressure control equipment. Its principal products include Cactus SafeDrill wellhead systems, conventional wellheads, and production valves among others. The company also provides mission-critical field services, including service crews to assist with the installation, maintenance, and safe handling of the wellhead and pressure control equipment, as well as repair services for equipment that it sells or rents. It sells or rents its products principally for onshore unconventional oil and gas wells that are utilized during the drilling, completion (including fracturing), and production. The company has two operating segments; Pressure Control, which generates key revenue and Spoolable Technologies.
Key Indicators: Cactus's Financial Health
Market Capitalization Perspectives: The company's market capitalization falls below industry averages, signaling a relatively smaller size compared to peers. This positioning may be influenced by factors such as perceived growth potential or operational scale.
Revenue Growth: Cactus's revenue growth over a period of 3M has been noteworthy. As of 31 March, 2025, the company achieved a revenue growth rate of approximately 2.26%. This indicates a substantial increase in the company's top-line earnings. As compared to its peers, the revenue growth lags behind its industry peers. The company achieved a growth rate lower than the average among peers in Energy sector.
Net Margin: Cactus's net margin surpasses industry standards, highlighting the company's exceptional financial performance. With an impressive 15.78% net margin, the company effectively manages costs and achieves strong profitability.
Return on Equity (ROE): Cactus's financial strength is reflected in its exceptional ROE, which exceeds industry averages. With a remarkable ROE of 4.06%, the company showcases efficient use of equity capital and strong financial health.
Return on Assets (ROA): The company's ROA is a standout performer, exceeding industry averages. With an impressive ROA of 2.52%, the company showcases effective utilization of assets.
Debt Management: Cactus's debt-to-equity ratio is below the industry average at 0.04, reflecting a lower dependency on debt financing and a more conservative financial approach.
Understanding the Relevance of Analyst Ratings
Within the domain of banking and financial systems, analysts specialize in reporting for specific stocks or defined sectors. Their work involves attending company conference calls and meetings, researching company financial statements, and communicating with insiders to publish "analyst ratings" for stocks. Analysts typically assess and rate each stock once per quarter.
Analysts may supplement their ratings with predictions for metrics like growth estimates, earnings, and revenue, offering investors a more comprehensive outlook. However, investors should be mindful that analysts, like any human, can have subjective perspectives influencing their forecasts.
Breaking: Wall Street's Next Big Mover
Benzinga's #1 analyst just identified a stock poised for explosive growth. This under-the-radar company could surge 200%+ as major market shifts unfold. Click here for urgent details.
This article was generated by Benzinga's automated content engine and reviewed by an editor.