
Key Insights
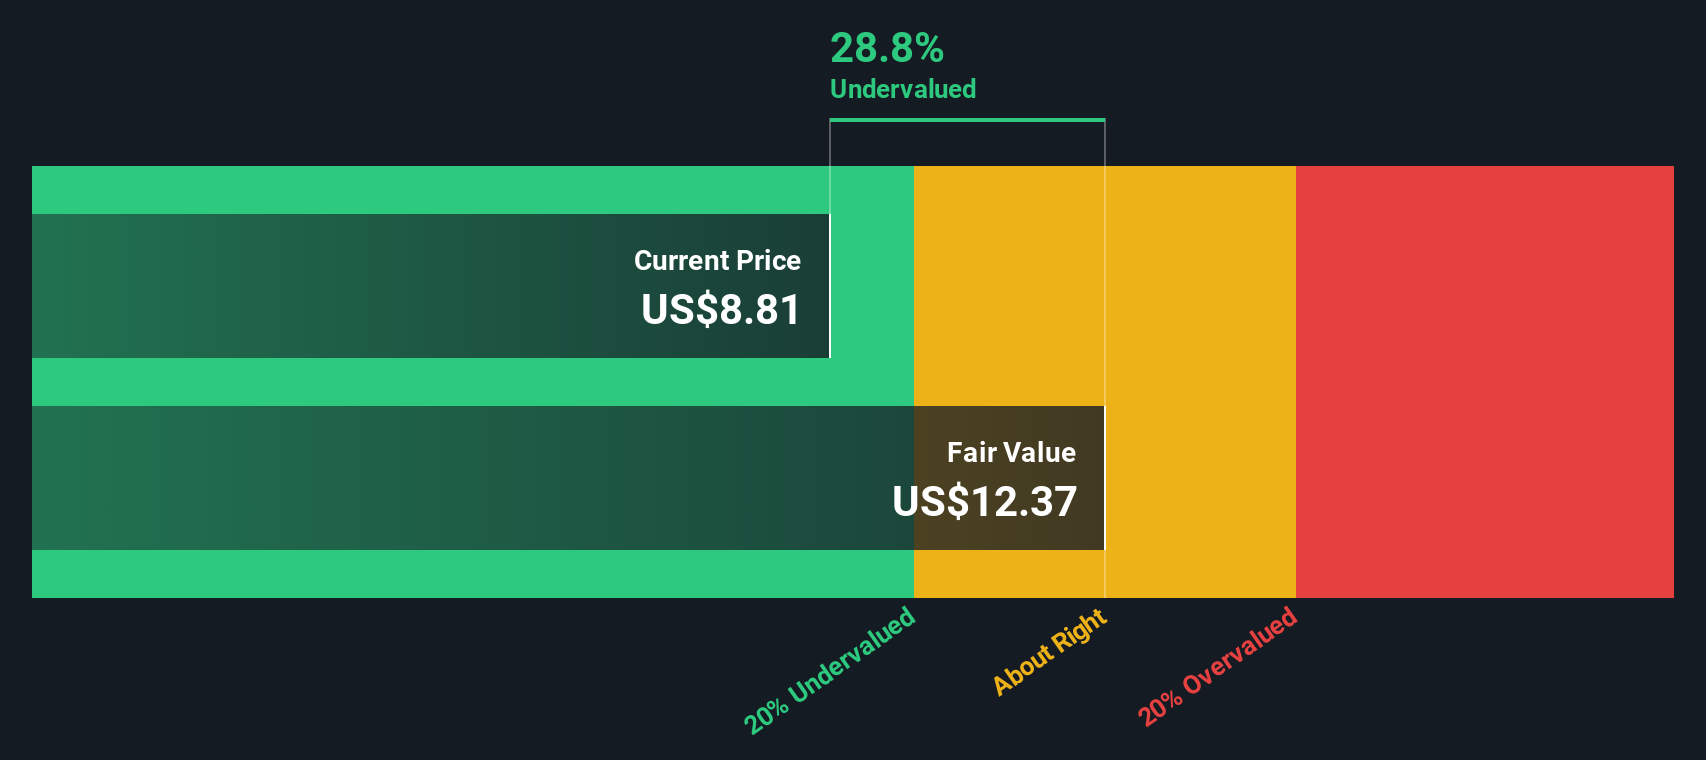
- Using the 2 Stage Free Cash Flow to Equity, Betterware de MéxicoP.I. de fair value estimate is US$12.37
- Current share price of US$8.81 suggests Betterware de MéxicoP.I. de is potentially 29% undervalued
- The average premium for Betterware de MéxicoP.I. de's competitorsis currently 50%
How far off is Betterware de México, S.A.P.I. de C.V. (NYSE:BWMX) from its intrinsic value? Using the most recent financial data, we'll take a look at whether the stock is fairly priced by taking the expected future cash flows and discounting them to their present value. We will use the Discounted Cash Flow (DCF) model on this occasion. It may sound complicated, but actually it is quite simple!
Remember though, that there are many ways to estimate a company's value, and a DCF is just one method. Anyone interested in learning a bit more about intrinsic value should have a read of the Simply Wall St analysis model.
Crunching The Numbers
We use what is known as a 2-stage model, which simply means we have two different periods of growth rates for the company's cash flows. Generally the first stage is higher growth, and the second stage is a lower growth phase. To begin with, we have to get estimates of the next ten years of cash flows. Where possible we use analyst estimates, but when these aren't available we extrapolate the previous free cash flow (FCF) from the last estimate or reported value. We assume companies with shrinking free cash flow will slow their rate of shrinkage, and that companies with growing free cash flow will see their growth rate slow, over this period. We do this to reflect that growth tends to slow more in the early years than it does in later years.
Generally we assume that a dollar today is more valuable than a dollar in the future, and so the sum of these future cash flows is then discounted to today's value:
10-year free cash flow (FCF) forecast
| 2025 | 2026 | 2027 | 2028 | 2029 | 2030 | 2031 | 2032 | 2033 | 2034 | |
| Levered FCF (MX$, Millions) | Mex$1.07b | Mex$1.35b | Mex$1.20b | Mex$1.11b | Mex$1.07b | Mex$1.05b | Mex$1.04b | Mex$1.05b | Mex$1.06b | Mex$1.08b |
| Growth Rate Estimate Source | Analyst x1 | Analyst x1 | Est @ -11.29% | Est @ -7.02% | Est @ -4.03% | Est @ -1.94% | Est @ -0.48% | Est @ 0.55% | Est @ 1.27% | Est @ 1.77% |
| Present Value (MX$, Millions) Discounted @ 14% | Mex$938 | Mex$1.0k | Mex$813 | Mex$665 | Mex$561 | Mex$483 | Mex$423 | Mex$374 | Mex$333 | Mex$298 |
("Est" = FCF growth rate estimated by Simply Wall St)
Present Value of 10-year Cash Flow (PVCF) = Mex$5.9b
The second stage is also known as Terminal Value, this is the business's cash flow after the first stage. The Gordon Growth formula is used to calculate Terminal Value at a future annual growth rate equal to the 5-year average of the 10-year government bond yield of 2.9%. We discount the terminal cash flows to today's value at a cost of equity of 14%.
Terminal Value (TV)= FCF2034 × (1 + g) ÷ (r – g) = Mex$1.1b× (1 + 2.9%) ÷ (14%– 2.9%) = Mex$10b
Present Value of Terminal Value (PVTV)= TV / (1 + r)10= Mex$10b÷ ( 1 + 14%)10= Mex$2.8b
The total value is the sum of cash flows for the next ten years plus the discounted terminal value, which results in the Total Equity Value, which in this case is Mex$8.8b. The last step is to then divide the equity value by the number of shares outstanding. Relative to the current share price of US$8.8, the company appears a touch undervalued at a 29% discount to where the stock price trades currently. Valuations are imprecise instruments though, rather like a telescope - move a few degrees and end up in a different galaxy. Do keep this in mind.
The Assumptions
Now the most important inputs to a discounted cash flow are the discount rate, and of course, the actual cash flows. You don't have to agree with these inputs, I recommend redoing the calculations yourself and playing with them. The DCF also does not consider the possible cyclicality of an industry, or a company's future capital requirements, so it does not give a full picture of a company's potential performance. Given that we are looking at Betterware de MéxicoP.I. de as potential shareholders, the cost of equity is used as the discount rate, rather than the cost of capital (or weighted average cost of capital, WACC) which accounts for debt. In this calculation we've used 14%, which is based on a levered beta of 1.572. Beta is a measure of a stock's volatility, compared to the market as a whole. We get our beta from the industry average beta of globally comparable companies, with an imposed limit between 0.8 and 2.0, which is a reasonable range for a stable business.
View our latest analysis for Betterware de MéxicoP.I. de
SWOT Analysis for Betterware de MéxicoP.I. de
- Debt is well covered by cash flow.
- Dividend is in the top 25% of dividend payers in the market.
- Earnings declined over the past year.
- Interest payments on debt are not well covered.
- Annual earnings are forecast to grow faster than the American market.
- Good value based on P/E ratio and estimated fair value.
- Dividends are not covered by earnings.
Moving On:
Valuation is only one side of the coin in terms of building your investment thesis, and it ideally won't be the sole piece of analysis you scrutinize for a company. It's not possible to obtain a foolproof valuation with a DCF model. Instead the best use for a DCF model is to test certain assumptions and theories to see if they would lead to the company being undervalued or overvalued. If a company grows at a different rate, or if its cost of equity or risk free rate changes sharply, the output can look very different. Why is the intrinsic value higher than the current share price? For Betterware de MéxicoP.I. de, we've put together three additional factors you should look at:
- Risks: You should be aware of the 3 warning signs for Betterware de MéxicoP.I. de (1 is concerning!) we've uncovered before considering an investment in the company.
- Future Earnings: How does BWMX's growth rate compare to its peers and the wider market? Dig deeper into the analyst consensus number for the upcoming years by interacting with our free analyst growth expectation chart.
- Other High Quality Alternatives: Do you like a good all-rounder? Explore our interactive list of high quality stocks to get an idea of what else is out there you may be missing!
PS. Simply Wall St updates its DCF calculation for every American stock every day, so if you want to find the intrinsic value of any other stock just search here.
Have feedback on this article? Concerned about the content? Get in touch with us directly. Alternatively, email editorial-team (at) simplywallst.com.
This article by Simply Wall St is general in nature. We provide commentary based on historical data and analyst forecasts only using an unbiased methodology and our articles are not intended to be financial advice. It does not constitute a recommendation to buy or sell any stock, and does not take account of your objectives, or your financial situation. We aim to bring you long-term focused analysis driven by fundamental data. Note that our analysis may not factor in the latest price-sensitive company announcements or qualitative material. Simply Wall St has no position in any stocks mentioned.