
GrafTech International Ltd. (NYSE:EAF) shareholders would be excited to see that the share price has had a great month, posting a 41% gain and recovering from prior weakness. The last 30 days bring the annual gain to a very sharp 26%.
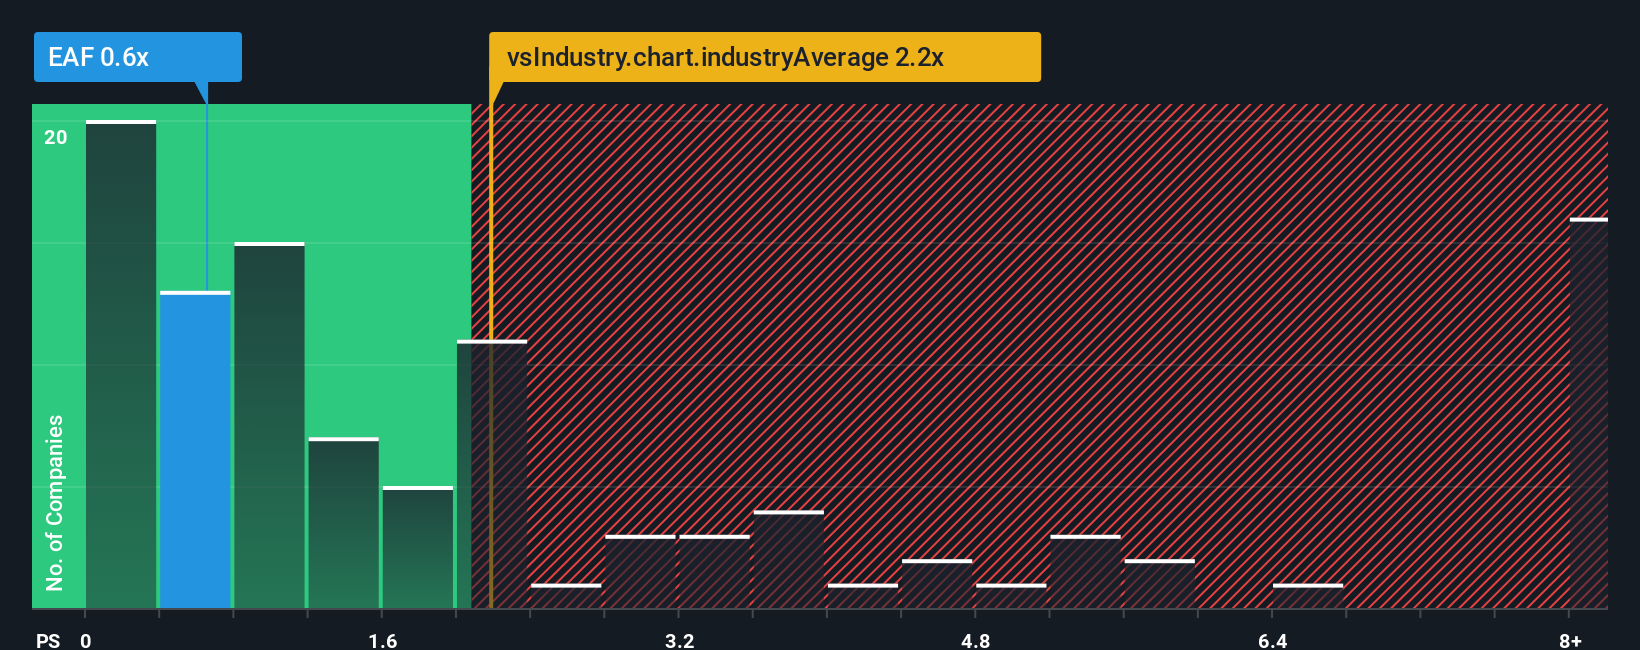
In spite of the firm bounce in price, GrafTech International may still be sending buy signals at present with its price-to-sales (or "P/S") ratio of 0.6x, considering almost half of all companies in the Electrical industry in the United States have P/S ratios greater than 2.2x and even P/S higher than 5x aren't out of the ordinary. Although, it's not wise to just take the P/S at face value as there may be an explanation why it's limited.
Check out our latest analysis for GrafTech International
How GrafTech International Has Been Performing
While the industry has experienced revenue growth lately, GrafTech International's revenue has gone into reverse gear, which is not great. Perhaps the P/S remains low as investors think the prospects of strong revenue growth aren't on the horizon. If you still like the company, you'd be hoping this isn't the case so that you could potentially pick up some stock while it's out of favour.
If you'd like to see what analysts are forecasting going forward, you should check out our free report on GrafTech International.What Are Revenue Growth Metrics Telling Us About The Low P/S?
The only time you'd be truly comfortable seeing a P/S as low as GrafTech International's is when the company's growth is on track to lag the industry.
In reviewing the last year of financials, we were disheartened to see the company's revenues fell to the tune of 17%. The last three years don't look nice either as the company has shrunk revenue by 63% in aggregate. So unfortunately, we have to acknowledge that the company has not done a great job of growing revenue over that time.
Shifting to the future, estimates from the four analysts covering the company suggest revenue should grow by 9.5% over the next year. That's shaping up to be similar to the 11% growth forecast for the broader industry.
With this information, we find it odd that GrafTech International is trading at a P/S lower than the industry. Apparently some shareholders are doubtful of the forecasts and have been accepting lower selling prices.
The Key Takeaway
GrafTech International's stock price has surged recently, but its but its P/S still remains modest. Using the price-to-sales ratio alone to determine if you should sell your stock isn't sensible, however it can be a practical guide to the company's future prospects.
We've seen that GrafTech International currently trades on a lower than expected P/S since its forecast growth is in line with the wider industry. Despite average revenue growth estimates, there could be some unobserved threats keeping the P/S low. Perhaps investors are concerned that the company could underperform against the forecasts over the near term.
Don't forget that there may be other risks. For instance, we've identified 3 warning signs for GrafTech International that you should be aware of.
If these risks are making you reconsider your opinion on GrafTech International, explore our interactive list of high quality stocks to get an idea of what else is out there.
Have feedback on this article? Concerned about the content? Get in touch with us directly. Alternatively, email editorial-team (at) simplywallst.com.
This article by Simply Wall St is general in nature. We provide commentary based on historical data and analyst forecasts only using an unbiased methodology and our articles are not intended to be financial advice. It does not constitute a recommendation to buy or sell any stock, and does not take account of your objectives, or your financial situation. We aim to bring you long-term focused analysis driven by fundamental data. Note that our analysis may not factor in the latest price-sensitive company announcements or qualitative material. Simply Wall St has no position in any stocks mentioned.