
Amidst the turbulence in global markets caused by geopolitical tensions and fluctuating oil prices, the U.S. stock market has been experiencing a mix of gains and setbacks, with major indices like the Dow Jones dropping significantly. Despite these challenges, small-cap stocks within the S&P 600 have shown resilience, offering potential opportunities for investors seeking undiscovered gems that could thrive in volatile conditions.
Top 10 Undiscovered Gems With Strong Fundamentals In The United States
| Name | Debt To Equity | Revenue Growth | Earnings Growth | Health Rating |
|---|---|---|---|---|
| West Bancorporation | 169.96% | -1.41% | -8.52% | ★★★★★★ |
| Oakworth Capital | 42.08% | 15.43% | 7.31% | ★★★★★★ |
| Metalpha Technology Holding | NA | 81.88% | -4.97% | ★★★★★★ |
| FineMark Holdings | 122.25% | 2.34% | -26.34% | ★★★★★★ |
| FRMO | 0.09% | 44.64% | 49.91% | ★★★★★☆ |
| Valhi | 43.01% | 1.55% | -2.64% | ★★★★★☆ |
| Gulf Island Fabrication | 19.65% | -2.17% | 42.26% | ★★★★★☆ |
| Solesence | 82.42% | 23.41% | -1.04% | ★★★★☆☆ |
| Reitar Logtech Holdings | 31.39% | 231.46% | 41.38% | ★★★★☆☆ |
| Vantage | 6.72% | -16.62% | -15.47% | ★★★★☆☆ |
Below we spotlight a couple of our favorites from our exclusive screener.
Southern Missouri Bancorp (SMBC)
Simply Wall St Value Rating: ★★★★★★
Overview: Southern Missouri Bancorp, Inc. is the bank holding company for Southern Bank, offering a range of banking and financial services to individuals and corporate clients in the United States, with a market cap of $612.34 million.
Operations: Southern Missouri Bancorp generates revenue primarily from its thrift/savings and loan institutions, totaling $172.93 million.
Southern Missouri Bancorp, with total assets of US$5 billion and equity of US$528.8 million, is carving out a promising niche through strategic expansions into St. Louis and Kansas City. This bank shows robust growth, with earnings up 7.9% over the past year compared to the industry’s 5.3%. It maintains a sufficient allowance for bad loans at 0.5% of total loans, indicating strong risk management practices. The company trades at a significant discount to its estimated fair value by about 50%, suggesting potential upside for investors who appreciate its low-risk funding structure and high-quality earnings profile.

Global Ship Lease (GSL)
Simply Wall St Value Rating: ★★★★★☆
Overview: Global Ship Lease, Inc. operates by owning and chartering containerships under fixed-rate charters to container shipping companies globally, with a market capitalization of approximately $917.74 million.
Operations: GSL generates revenue primarily through fixed-rate charters of its containerships, totaling approximately $715.23 million. The company's market capitalization is around $917.74 million.
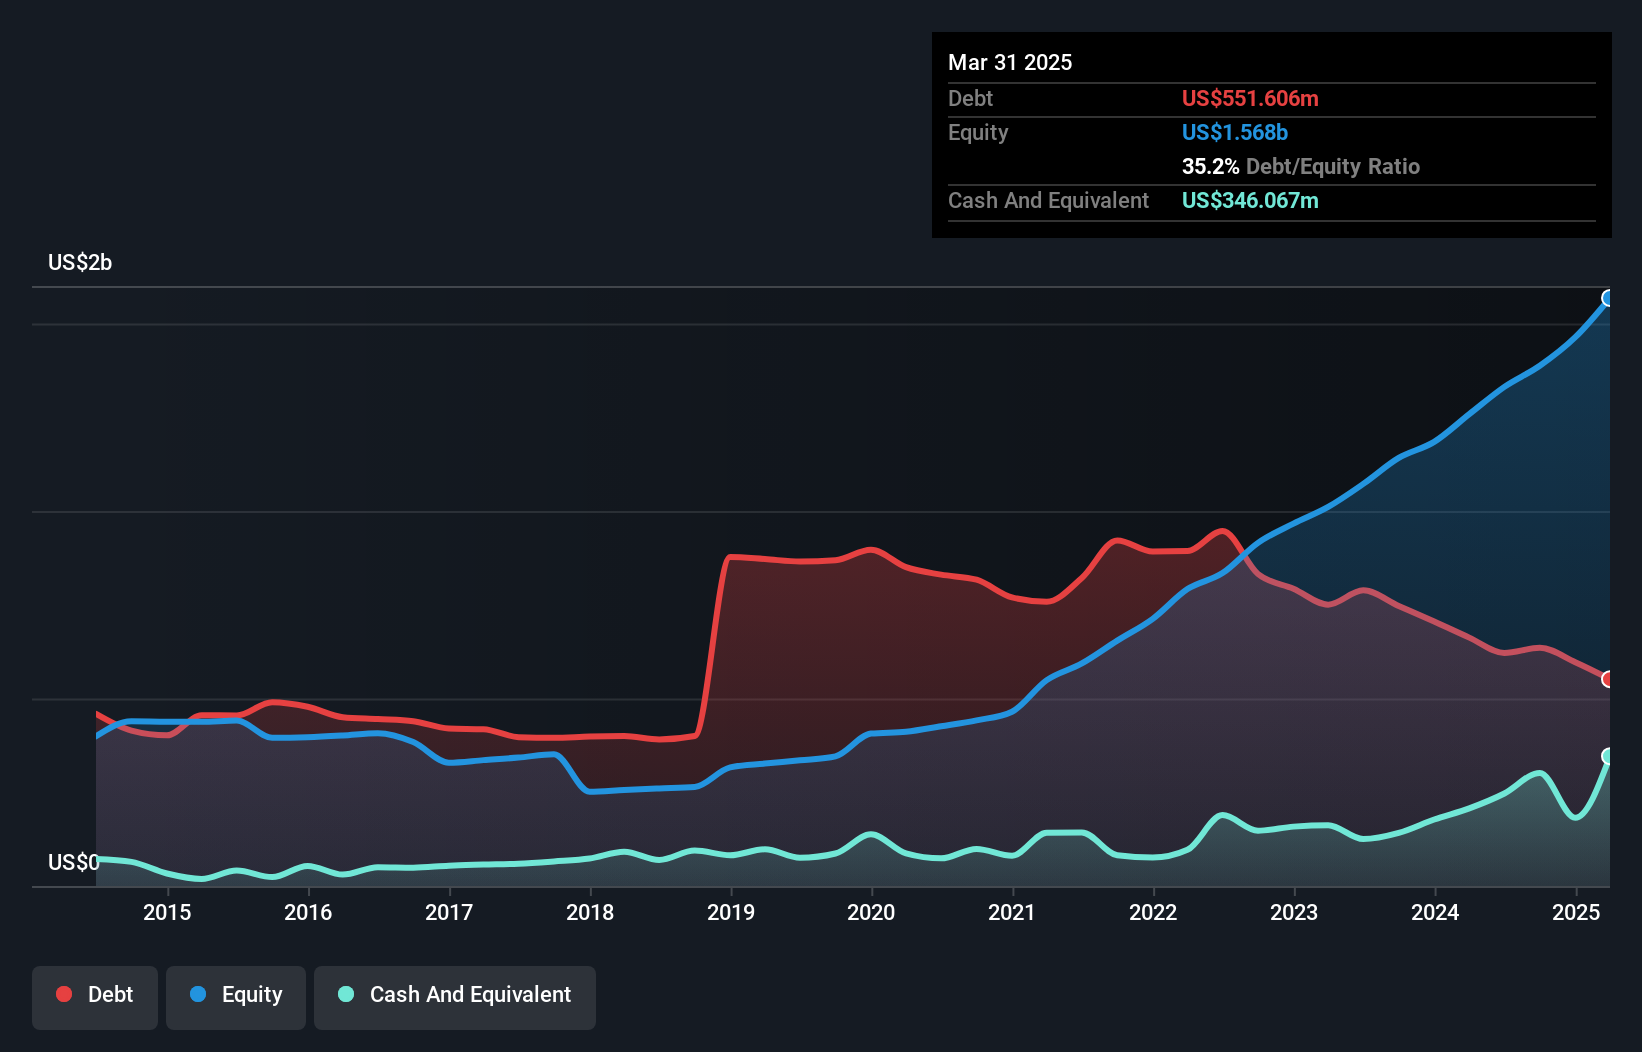
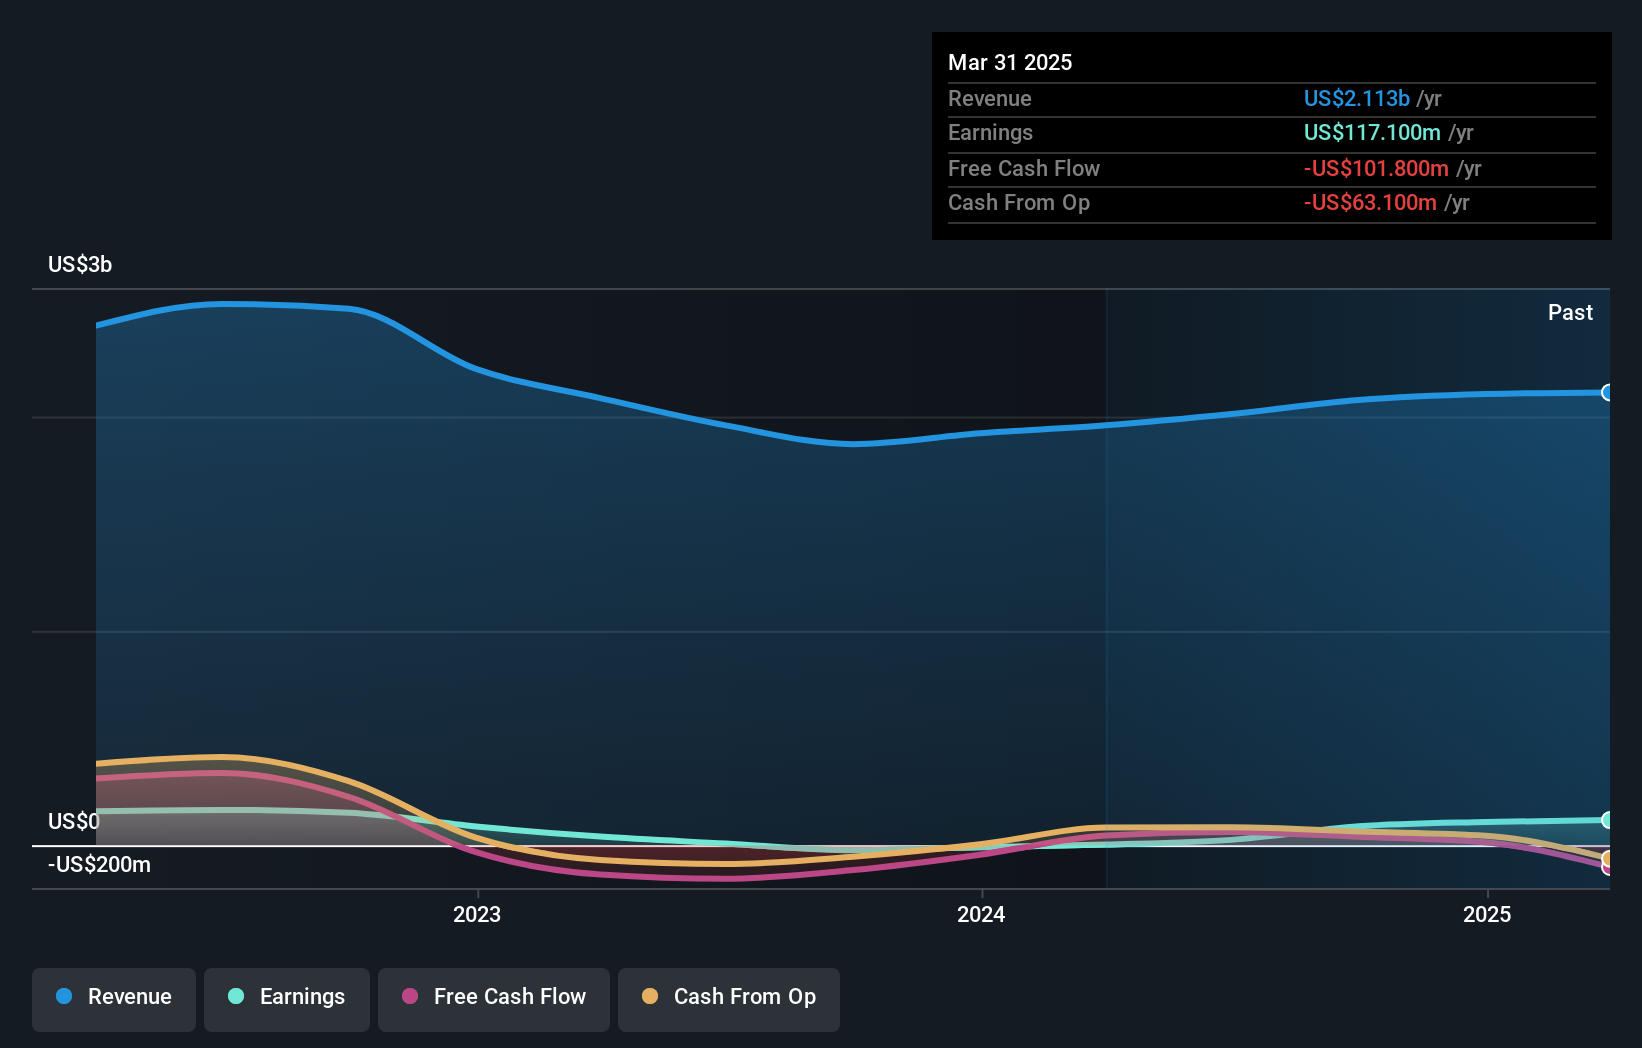
Global Ship Lease, a player in the shipping industry, has seen its earnings grow by 20% over the past year, outpacing the industry's -5% performance. The company's debt management is commendable with a net debt to equity ratio of 13%, and interest payments are well covered by EBIT at 23 times. Trading at 80% below estimated fair value suggests potential for investors seeking undervalued opportunities. Recent financials show revenue of US$190.98 million and net income of US$123.39 million for Q1 2025, reflecting robust profitability with basic earnings per share rising to US$3.4 from last year's US$2.54.
Valhi (VHI)
Simply Wall St Value Rating: ★★★★★☆
Overview: Valhi, Inc. operates in the chemicals, component products, and real estate management and development sectors across Europe, North America, the Asia Pacific, and internationally with a market cap of approximately $447.62 million.
Operations: Valhi's revenue streams are primarily derived from chemicals ($1.90 billion), component products ($148.20 million), and real estate management and development ($66.50 million).
Valhi's recent performance has been marked by a significant one-off gain of US$50.4M, contributing to an impressive earnings growth of 4082% over the past year, far outpacing the chemicals industry's -3.4%. The company's debt situation has improved, with its debt-to-equity ratio dropping from 81% to 43% over five years and a satisfactory net debt-to-equity ratio at 29.1%. Although free cash flow is not positive, Valhi's interest payments are well covered by EBIT at 7.7x coverage. Its price-to-earnings ratio stands attractively low at 3.8x compared to the US market average of 18.1x.
- Take a closer look at Valhi's potential here in our health report.
Gain insights into Valhi's past trends and performance with our Past report.
Seize The Opportunity
- Click through to start exploring the rest of the 281 US Undiscovered Gems With Strong Fundamentals now.
- Hold shares in these firms? Setup your portfolio in Simply Wall St to seamlessly track your investments and receive personalized updates on your portfolio's performance.
- Unlock the power of informed investing with Simply Wall St, your free guide to navigating stock markets worldwide.
Ready For A Different Approach?
- Explore high-performing small cap companies that haven't yet garnered significant analyst attention.
- Fuel your portfolio with companies showing strong growth potential, backed by optimistic outlooks both from analysts and management.
- Find companies with promising cash flow potential yet trading below their fair value.
This article by Simply Wall St is general in nature. We provide commentary based on historical data and analyst forecasts only using an unbiased methodology and our articles are not intended to be financial advice. It does not constitute a recommendation to buy or sell any stock, and does not take account of your objectives, or your financial situation. We aim to bring you long-term focused analysis driven by fundamental data. Note that our analysis may not factor in the latest price-sensitive company announcements or qualitative material. Simply Wall St has no position in any stocks mentioned.
Have feedback on this article? Concerned about the content? Get in touch with us directly. Alternatively, email editorial-team@simplywallst.com