
For many, the main point of investing is to generate higher returns than the overall market. But every investor is virtually certain to have both over-performing and under-performing stocks. So we wouldn't blame long term Under Armour, Inc. (NYSE:UAA) shareholders for doubting their decision to hold, with the stock down 30% over a half decade. Contrary to the longer term story, the last month has been good for stockholders, with a share price gain of 9.1%.
On a more encouraging note the company has added US$115m to its market cap in just the last 7 days, so let's see if we can determine what's driven the five-year loss for shareholders.
To paraphrase Benjamin Graham: Over the short term the market is a voting machine, but over the long term it's a weighing machine. One imperfect but simple way to consider how the market perception of a company has shifted is to compare the change in the earnings per share (EPS) with the share price movement.
We know that Under Armour has been profitable in the past. However, it made a loss in the last twelve months, suggesting profit may be an unreliable metric at this stage. Other metrics may better explain the share price move.
In contrast to the share price, revenue has actually increased by 3.2% a year in the five year period. A more detailed examination of the revenue and earnings may or may not explain why the share price languishes; there could be an opportunity.
The graphic below depicts how earnings and revenue have changed over time (unveil the exact values by clicking on the image).
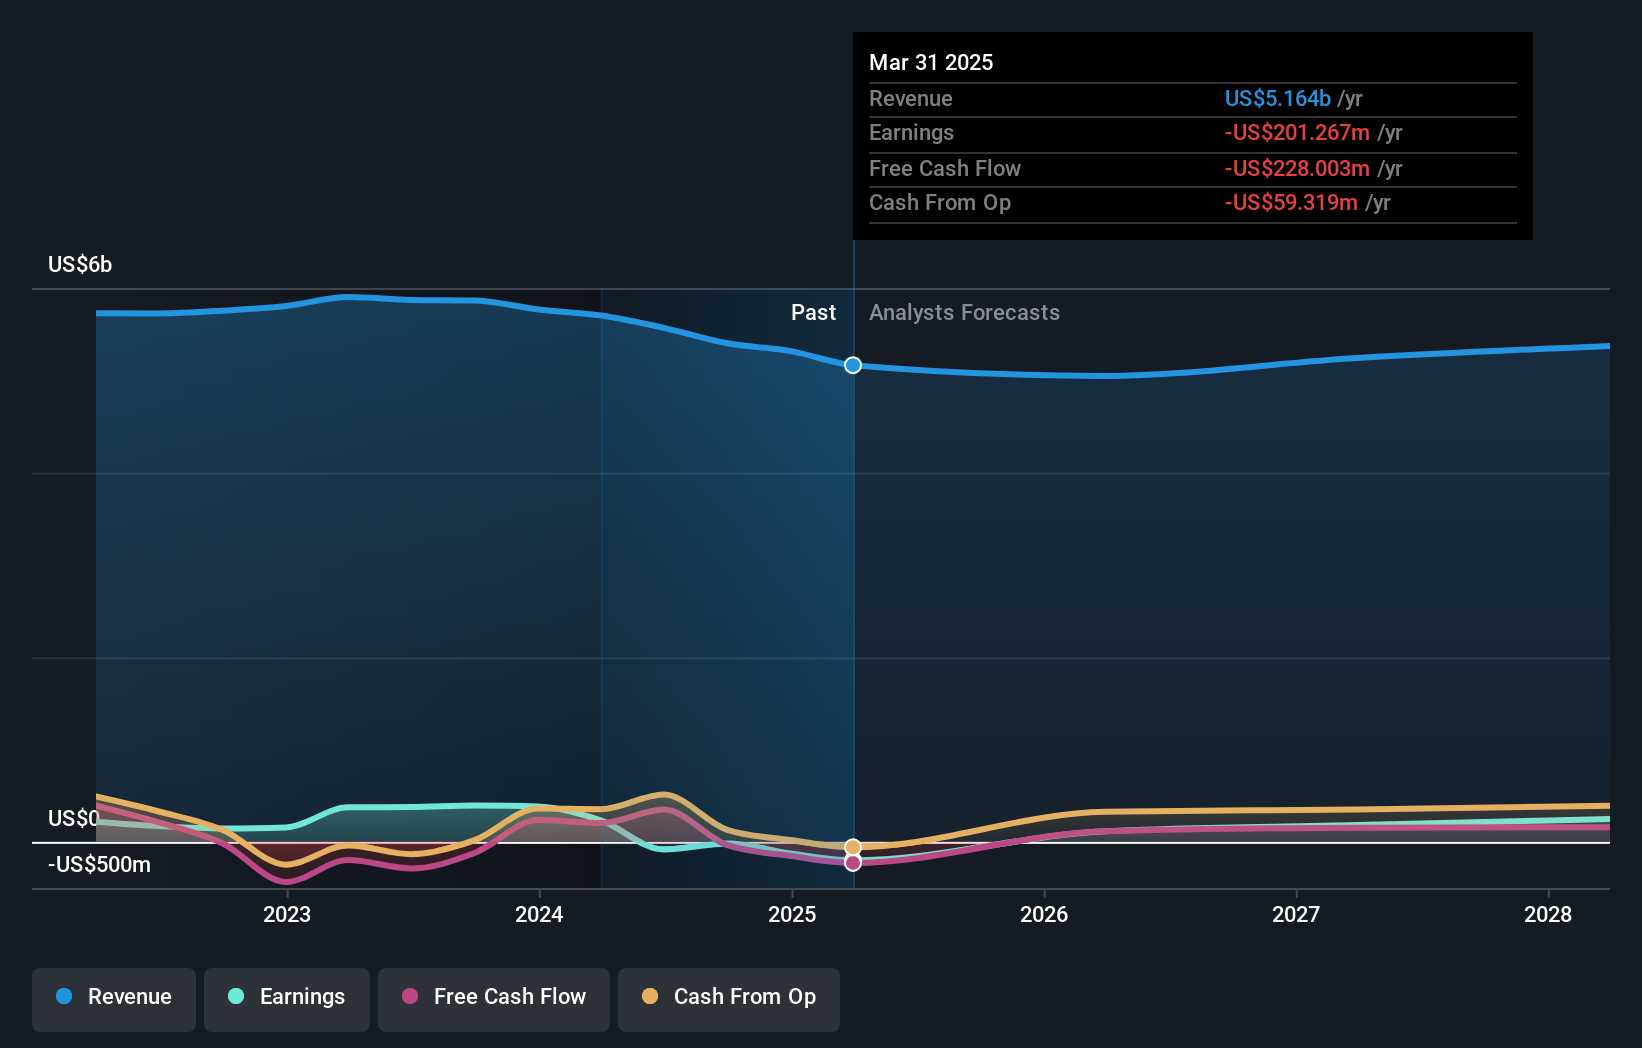
Under Armour is well known by investors, and plenty of clever analysts have tried to predict the future profit levels. So it makes a lot of sense to check out what analysts think Under Armour will earn in the future (free analyst consensus estimates)

A Different Perspective
Under Armour shareholders gained a total return of 1.2% during the year. But that return falls short of the market. But at least that's still a gain! Over five years the TSR has been a reduction of 5% per year, over five years. So this might be a sign the business has turned its fortunes around. You might want to assess this data-rich visualization of its earnings, revenue and cash flow.
If you are like me, then you will not want to miss this free list of undervalued small caps that insiders are buying.
Please note, the market returns quoted in this article reflect the market weighted average returns of stocks that currently trade on American exchanges.
Have feedback on this article? Concerned about the content? Get in touch with us directly. Alternatively, email editorial-team (at) simplywallst.com.
This article by Simply Wall St is general in nature. We provide commentary based on historical data and analyst forecasts only using an unbiased methodology and our articles are not intended to be financial advice. It does not constitute a recommendation to buy or sell any stock, and does not take account of your objectives, or your financial situation. We aim to bring you long-term focused analysis driven by fundamental data. Note that our analysis may not factor in the latest price-sensitive company announcements or qualitative material. Simply Wall St has no position in any stocks mentioned.