
When you buy and hold a stock for the long term, you definitely want it to provide a positive return. Furthermore, you'd generally like to see the share price rise faster than the market. Unfortunately for shareholders, while the MSC Industrial Direct Co., Inc. (NYSE:MSM) share price is up 12% in the last five years, that's less than the market return. The last year has been disappointing, with the stock price down 3.6% in that time.
Now it's worth having a look at the company's fundamentals too, because that will help us determine if the long term shareholder return has matched the performance of the underlying business.
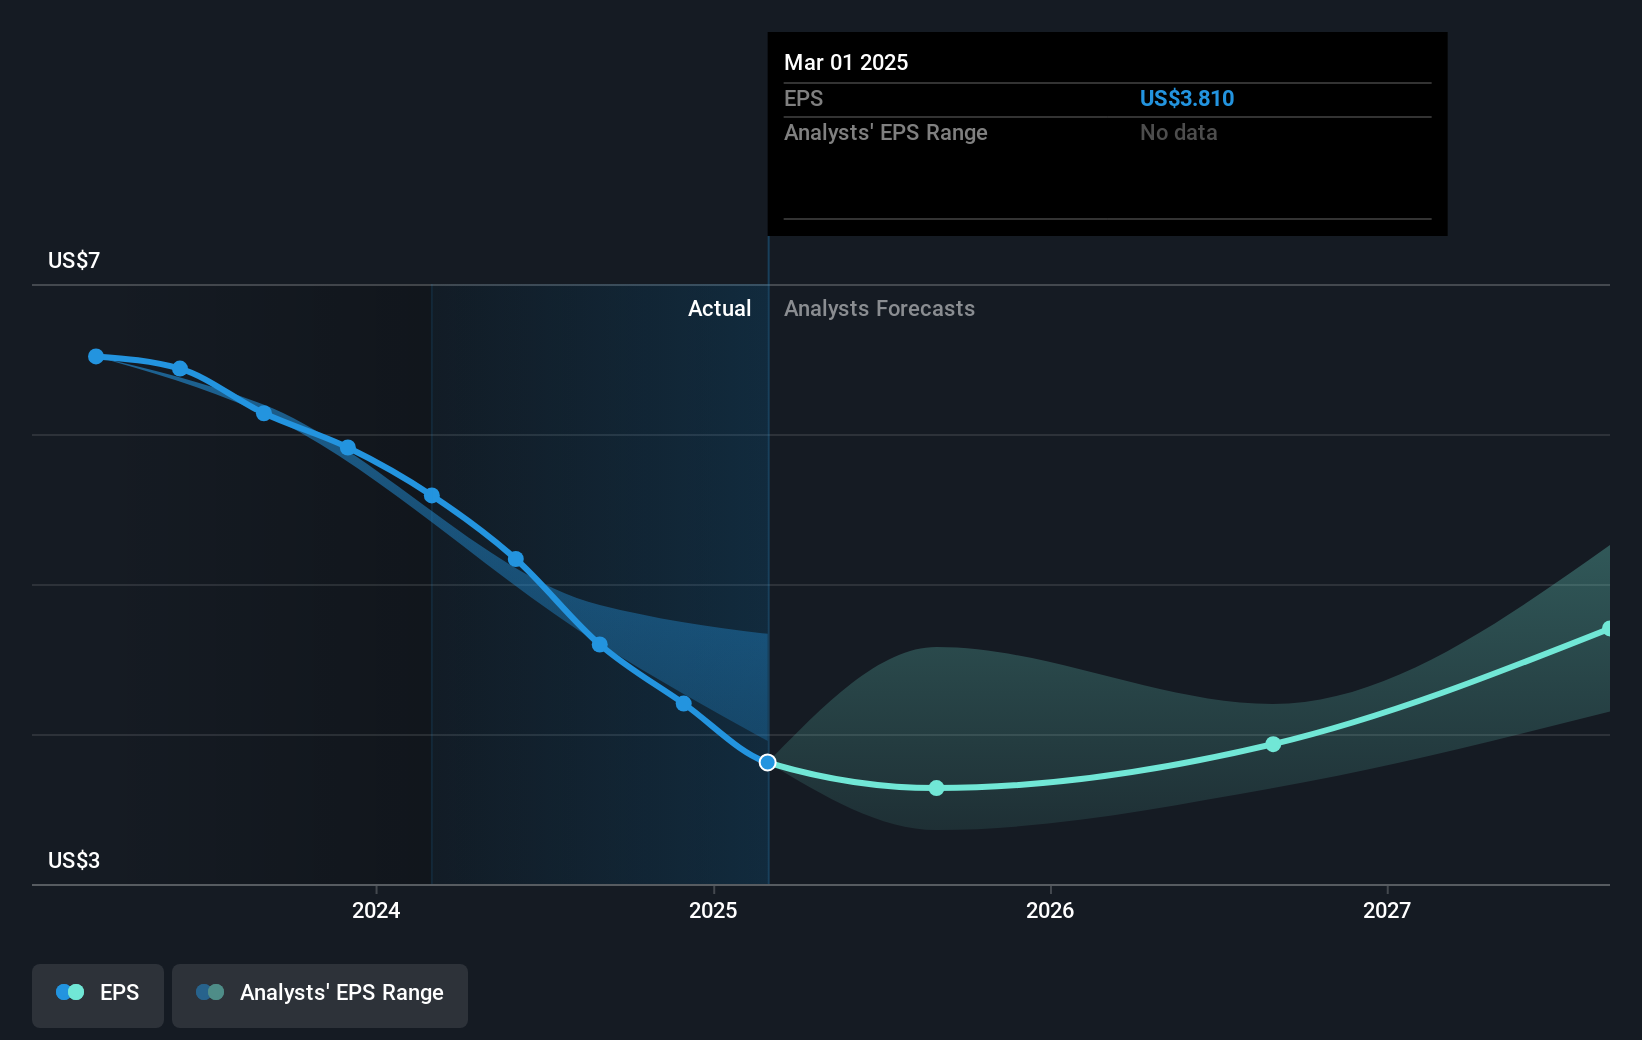
There is no denying that markets are sometimes efficient, but prices do not always reflect underlying business performance. By comparing earnings per share (EPS) and share price changes over time, we can get a feel for how investor attitudes to a company have morphed over time.
MSC Industrial Direct's earnings per share are down 4.5% per year, despite strong share price performance over five years.
Since EPS is down a bit, and the share price is up, it's probably that the market previously had some concerns about the company, but the reality has been better than feared. In the long term, though, it will be hard for the share price rises to continue without improving EPS.
You can see below how EPS has changed over time (discover the exact values by clicking on the image).
It's probably worth noting we've seen significant insider buying in the last quarter, which we consider a positive. On the other hand, we think the revenue and earnings trends are much more meaningful measures of the business. It might be well worthwhile taking a look at our free report on MSC Industrial Direct's earnings, revenue and cash flow.

What About Dividends?
When looking at investment returns, it is important to consider the difference between total shareholder return (TSR) and share price return. The TSR is a return calculation that accounts for the value of cash dividends (assuming that any dividend received was reinvested) and the calculated value of any discounted capital raisings and spin-offs. It's fair to say that the TSR gives a more complete picture for stocks that pay a dividend. In the case of MSC Industrial Direct, it has a TSR of 42% for the last 5 years. That exceeds its share price return that we previously mentioned. The dividends paid by the company have thusly boosted the total shareholder return.
A Different Perspective
MSC Industrial Direct provided a TSR of 0.7% over the last twelve months. But that was short of the market average. It's probably a good sign that the company has an even better long term track record, having provided shareholders with an annual TSR of 7% over five years. Maybe the share price is just taking a breather while the business executes on its growth strategy. It is all well and good that insiders have been buying shares, but we suggest you check here to see what price insiders were buying at.
There are plenty of other companies that have insiders buying up shares. You probably do not want to miss this free list of undervalued small cap companies that insiders are buying.
Please note, the market returns quoted in this article reflect the market weighted average returns of stocks that currently trade on American exchanges.
Have feedback on this article? Concerned about the content? Get in touch with us directly. Alternatively, email editorial-team (at) simplywallst.com.
This article by Simply Wall St is general in nature. We provide commentary based on historical data and analyst forecasts only using an unbiased methodology and our articles are not intended to be financial advice. It does not constitute a recommendation to buy or sell any stock, and does not take account of your objectives, or your financial situation. We aim to bring you long-term focused analysis driven by fundamental data. Note that our analysis may not factor in the latest price-sensitive company announcements or qualitative material. Simply Wall St has no position in any stocks mentioned.