
Six Flags Entertainment (NYSE:FUN) underwent analysis by 16 analysts in the last quarter, revealing a spectrum of viewpoints from bullish to bearish.
The table below provides a snapshot of their recent ratings, showcasing how sentiments have evolved over the past 30 days and comparing them to the preceding months.
| Bullish | Somewhat Bullish | Indifferent | Somewhat Bearish | Bearish | |
|---|---|---|---|---|---|
| Total Ratings | 7 | 7 | 1 | 1 | 0 |
| Last 30D | 1 | 1 | 0 | 0 | 0 |
| 1M Ago | 0 | 3 | 1 | 0 | 0 |
| 2M Ago | 5 | 0 | 0 | 1 | 0 |
| 3M Ago | 1 | 3 | 0 | 0 | 0 |
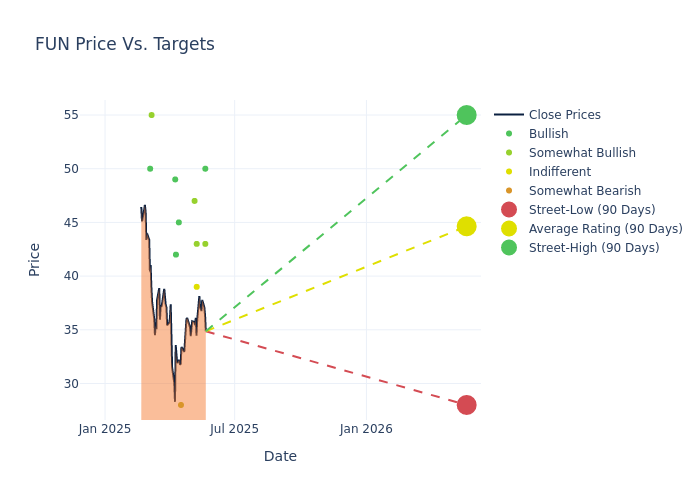
Analysts' evaluations of 12-month price targets offer additional insights, showcasing an average target of $45.94, with a high estimate of $55.00 and a low estimate of $28.00. A 12.01% drop is evident in the current average compared to the previous average price target of $52.21.
Diving into Analyst Ratings: An In-Depth Exploration
In examining recent analyst actions, we gain insights into how financial experts perceive Six Flags Entertainment. The following summary outlines key analysts, their recent evaluations, and adjustments to ratings and price targets.
| Analyst | Analyst Firm | Action Taken | Rating | Current Price Target | Prior Price Target |
|---|---|---|---|---|---|
| Steven Wieczynski | Stifel | Raises | Buy | $50.00 | $48.00 |
| Brandt Montour | Barclays | Raises | Overweight | $43.00 | $41.00 |
| Ben Chaiken | Mizuho | Lowers | Outperform | $43.00 | $50.00 |
| Lizzie Dove | Goldman Sachs | Lowers | Neutral | $39.00 | $45.00 |
| Ben Chaiken | Mizuho | Raises | Outperform | $50.00 | $49.00 |
| Thomas Yeh | Morgan Stanley | Lowers | Overweight | $47.00 | $58.00 |
| Matthew Boss | JP Morgan | Lowers | Underweight | $28.00 | $46.00 |
| Michael Swartz | Truist Securities | Lowers | Buy | $45.00 | $52.00 |
| Steven Wieczynski | Stifel | Lowers | Buy | $52.00 | $64.00 |
| David Katz | Jefferies | Lowers | Buy | $42.00 | $58.00 |
| Arpine Kocharyan | UBS | Announces | Buy | $49.00 | - |
| Michael Swartz | Truist Securities | Lowers | Buy | $52.00 | $56.00 |
| Ben Chaiken | Mizuho | Lowers | Outperform | $49.00 | $54.00 |
| Brandt Montour | Barclays | Announces | Overweight | $41.00 | - |
| Paul Golding | Macquarie | Maintains | Outperform | $55.00 | $55.00 |
| Curry Baker | Guggenheim | Lowers | Buy | $50.00 | $55.00 |
Key Insights:
- Action Taken: Analysts frequently update their recommendations based on evolving market conditions and company performance. Whether they 'Maintain', 'Raise' or 'Lower' their stance, it reflects their reaction to recent developments related to Six Flags Entertainment. This information provides a snapshot of how analysts perceive the current state of the company.
- Rating: Analyzing trends, analysts offer qualitative evaluations, ranging from 'Outperform' to 'Underperform'. These ratings convey expectations for the relative performance of Six Flags Entertainment compared to the broader market.
- Price Targets: Gaining insights, analysts provide estimates for the future value of Six Flags Entertainment's stock. This comparison reveals trends in analysts' expectations over time.
Assessing these analyst evaluations alongside crucial financial indicators can provide a comprehensive overview of Six Flags Entertainment's market position. Stay informed and make well-judged decisions with the assistance of our Ratings Table.
Stay up to date on Six Flags Entertainment analyst ratings.
Discovering Six Flags Entertainment: A Closer Look
Six Flags Entertainment Corp is North America's regional amusement resort operator with approximately 27 amusement parks, around 15 separately gated water parks, and nine resort properties across the U.S., Canada, and Mexico. It provides coasters, themed rides, thrilling water parks, resorts, and a portfolio of beloved intellectual properties such as Looney Tunes, DC Comics, and PEANUTS.
Six Flags Entertainment: A Financial Overview
Market Capitalization: Boasting an elevated market capitalization, the company surpasses industry averages. This signals substantial size and strong market recognition.
Revenue Growth: Six Flags Entertainment's revenue growth over a period of 3M has been noteworthy. As of 31 March, 2025, the company achieved a revenue growth rate of approximately 98.85%. This indicates a substantial increase in the company's top-line earnings. As compared to competitors, the company surpassed expectations with a growth rate higher than the average among peers in the Consumer Discretionary sector.
Net Margin: Six Flags Entertainment's net margin is below industry averages, indicating potential challenges in maintaining strong profitability. With a net margin of -108.74%, the company may face hurdles in effective cost management.
Return on Equity (ROE): Six Flags Entertainment's ROE falls below industry averages, indicating challenges in efficiently using equity capital. With an ROE of -11.34%, the company may face hurdles in generating optimal returns for shareholders.
Return on Assets (ROA): Six Flags Entertainment's ROA lags behind industry averages, suggesting challenges in maximizing returns from its assets. With an ROA of -2.4%, the company may face hurdles in achieving optimal financial performance.
Debt Management: Six Flags Entertainment's debt-to-equity ratio is below industry norms, indicating a sound financial structure with a ratio of 2.99.
The Significance of Analyst Ratings Explained
Benzinga tracks 150 analyst firms and reports on their stock expectations. Analysts typically arrive at their conclusions by predicting how much money a company will make in the future, usually the upcoming five years, and how risky or predictable that company's revenue streams are.
Analysts attend company conference calls and meetings, research company financial statements, and communicate with insiders to publish their ratings on stocks. Analysts typically rate each stock once per quarter or whenever the company has a major update.
In addition to their assessments, some analysts extend their insights by offering predictions for key metrics such as earnings, revenue, and growth estimates. This supplementary information provides further guidance for traders. It is crucial to recognize that, despite their specialization, analysts are human and can only provide forecasts based on their beliefs.
Breaking: Wall Street's Next Big Mover
Benzinga's #1 analyst just identified a stock poised for explosive growth. This under-the-radar company could surge 200%+ as major market shifts unfold. Click here for urgent details.
This article was generated by Benzinga's automated content engine and reviewed by an editor.