
Shenzhou International Group Holdings Limited (HKG:2313) shareholders should be happy to see the share price up 19% in the last month. But that cannot eclipse the less-than-impressive returns over the last three years. Truth be told the share price declined 42% in three years and that return, Dear Reader, falls short of what you could have got from passive investing with an index fund.
While the stock has risen 4.4% in the past week but long term shareholders are still in the red, let's see what the fundamentals can tell us.
To quote Buffett, 'Ships will sail around the world but the Flat Earth Society will flourish. There will continue to be wide discrepancies between price and value in the marketplace...' One way to examine how market sentiment has changed over time is to look at the interaction between a company's share price and its earnings per share (EPS).
Although the share price is down over three years, Shenzhou International Group Holdings actually managed to grow EPS by 23% per year in that time. This is quite a puzzle, and suggests there might be something temporarily buoying the share price. Alternatively, growth expectations may have been unreasonable in the past.
It's worth taking a look at other metrics, because the EPS growth doesn't seem to match with the falling share price.
We note that the dividend seems healthy enough, so that probably doesn't explain the share price drop. Revenue has been pretty flat over three years, so that isn't an obvious reason shareholders would sell. So it might be worth looking at how revenue growth over time, in greater detail.
The graphic below depicts how earnings and revenue have changed over time (unveil the exact values by clicking on the image).
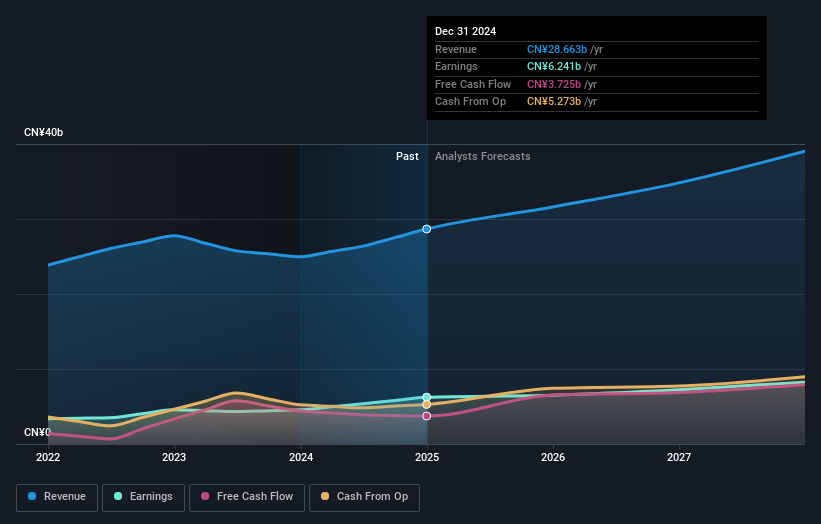
It's probably worth noting we've seen significant insider buying in the last quarter, which we consider a positive. That said, we think earnings and revenue growth trends are even more important factors to consider. This free report showing analyst forecasts should help you form a view on Shenzhou International Group Holdings
What About Dividends?
As well as measuring the share price return, investors should also consider the total shareholder return (TSR). The TSR is a return calculation that accounts for the value of cash dividends (assuming that any dividend received was reinvested) and the calculated value of any discounted capital raisings and spin-offs. Arguably, the TSR gives a more comprehensive picture of the return generated by a stock. We note that for Shenzhou International Group Holdings the TSR over the last 3 years was -37%, which is better than the share price return mentioned above. And there's no prize for guessing that the dividend payments largely explain the divergence!
A Different Perspective
Shenzhou International Group Holdings shareholders are down 30% for the year (even including dividends), but the market itself is up 21%. However, keep in mind that even the best stocks will sometimes underperform the market over a twelve month period. Unfortunately, last year's performance may indicate unresolved challenges, given that it was worse than the annualised loss of 6% over the last half decade. Generally speaking long term share price weakness can be a bad sign, though contrarian investors might want to research the stock in hope of a turnaround. It's always interesting to track share price performance over the longer term. But to understand Shenzhou International Group Holdings better, we need to consider many other factors. Take risks, for example - Shenzhou International Group Holdings has 1 warning sign we think you should be aware of.
Shenzhou International Group Holdings is not the only stock insiders are buying. So take a peek at this free list of small cap companies at attractive valuations which insiders have been buying.
Please note, the market returns quoted in this article reflect the market weighted average returns of stocks that currently trade on Hong Kong exchanges.
Have feedback on this article? Concerned about the content? Get in touch with us directly. Alternatively, email editorial-team (at) simplywallst.com.
This article by Simply Wall St is general in nature. We provide commentary based on historical data and analyst forecasts only using an unbiased methodology and our articles are not intended to be financial advice. It does not constitute a recommendation to buy or sell any stock, and does not take account of your objectives, or your financial situation. We aim to bring you long-term focused analysis driven by fundamental data. Note that our analysis may not factor in the latest price-sensitive company announcements or qualitative material. Simply Wall St has no position in any stocks mentioned.