
YNBY International Limited (HKG:30) shareholders are no doubt pleased to see that the share price has bounced 34% in the last month, although it is still struggling to make up recently lost ground. Looking further back, the 21% rise over the last twelve months isn't too bad notwithstanding the strength over the last 30 days.
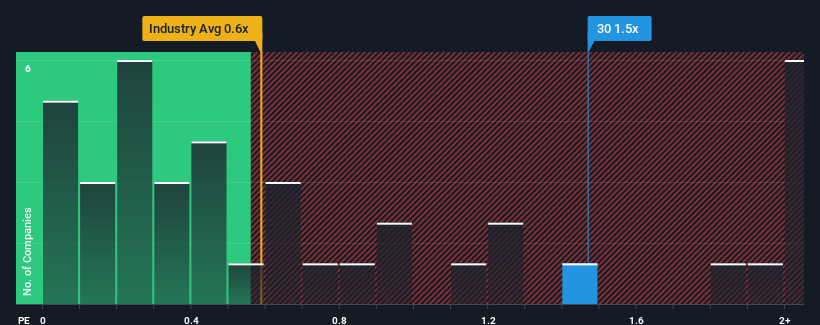
After such a large jump in price, you could be forgiven for thinking YNBY International is a stock not worth researching with a price-to-sales ratios (or "P/S") of 1.5x, considering almost half the companies in Hong Kong's Consumer Retailing industry have P/S ratios below 0.6x. However, the P/S might be high for a reason and it requires further investigation to determine if it's justified.
Our free stock report includes 2 warning signs investors should be aware of before investing in YNBY International. Read for free now.View our latest analysis for YNBY International
How YNBY International Has Been Performing
For instance, YNBY International's receding revenue in recent times would have to be some food for thought. One possibility is that the P/S is high because investors think the company will still do enough to outperform the broader industry in the near future. If not, then existing shareholders may be quite nervous about the viability of the share price.
Although there are no analyst estimates available for YNBY International, take a look at this free data-rich visualisation to see how the company stacks up on earnings, revenue and cash flow.Is There Enough Revenue Growth Forecasted For YNBY International?
YNBY International's P/S ratio would be typical for a company that's expected to deliver solid growth, and importantly, perform better than the industry.
Retrospectively, the last year delivered a frustrating 2.2% decrease to the company's top line. Regardless, revenue has managed to lift by a handy 22% in aggregate from three years ago, thanks to the earlier period of growth. Accordingly, while they would have preferred to keep the run going, shareholders would be roughly satisfied with the medium-term rates of revenue growth.
Comparing that to the industry, which is predicted to deliver 10% growth in the next 12 months, the company's momentum is weaker, based on recent medium-term annualised revenue results.
With this information, we find it concerning that YNBY International is trading at a P/S higher than the industry. It seems most investors are ignoring the fairly limited recent growth rates and are hoping for a turnaround in the company's business prospects. Only the boldest would assume these prices are sustainable as a continuation of recent revenue trends is likely to weigh heavily on the share price eventually.
The Key Takeaway
YNBY International's P/S is on the rise since its shares have risen strongly. Using the price-to-sales ratio alone to determine if you should sell your stock isn't sensible, however it can be a practical guide to the company's future prospects.
The fact that YNBY International currently trades on a higher P/S relative to the industry is an oddity, since its recent three-year growth is lower than the wider industry forecast. Right now we aren't comfortable with the high P/S as this revenue performance isn't likely to support such positive sentiment for long. If recent medium-term revenue trends continue, it will place shareholders' investments at significant risk and potential investors in danger of paying an excessive premium.
There are also other vital risk factors to consider before investing and we've discovered 2 warning signs for YNBY International that you should be aware of.
Of course, profitable companies with a history of great earnings growth are generally safer bets. So you may wish to see this free collection of other companies that have reasonable P/E ratios and have grown earnings strongly.
Have feedback on this article? Concerned about the content? Get in touch with us directly. Alternatively, email editorial-team (at) simplywallst.com.
This article by Simply Wall St is general in nature. We provide commentary based on historical data and analyst forecasts only using an unbiased methodology and our articles are not intended to be financial advice. It does not constitute a recommendation to buy or sell any stock, and does not take account of your objectives, or your financial situation. We aim to bring you long-term focused analysis driven by fundamental data. Note that our analysis may not factor in the latest price-sensitive company announcements or qualitative material. Simply Wall St has no position in any stocks mentioned.