
In the last three months, 16 analysts have published ratings on T. Rowe Price Group (NASDAQ:TROW), offering a diverse range of perspectives from bullish to bearish.
In the table below, you'll find a summary of their recent ratings, revealing the shifting sentiments over the past 30 days and comparing them to the previous months.
| Bullish | Somewhat Bullish | Indifferent | Somewhat Bearish | Bearish | |
|---|---|---|---|---|---|
| Total Ratings | 0 | 0 | 9 | 5 | 2 |
| Last 30D | 0 | 0 | 1 | 0 | 0 |
| 1M Ago | 0 | 0 | 4 | 3 | 1 |
| 2M Ago | 0 | 0 | 1 | 1 | 1 |
| 3M Ago | 0 | 0 | 3 | 1 | 0 |
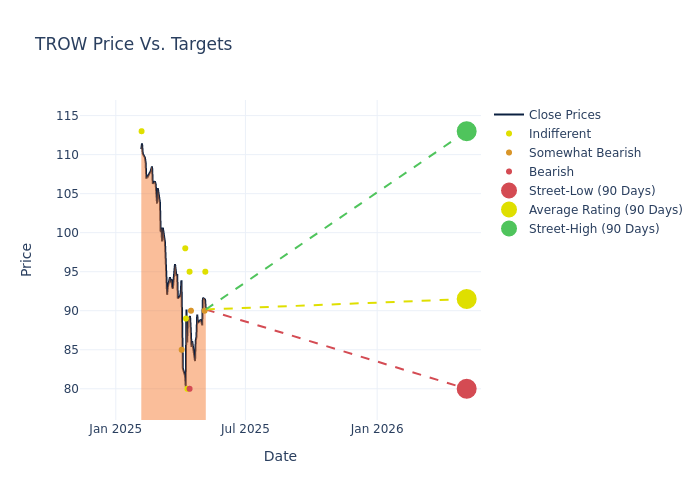
Analysts have set 12-month price targets for T. Rowe Price Group, revealing an average target of $95.69, a high estimate of $121.00, and a low estimate of $80.00. This current average represents a 9.73% decrease from the previous average price target of $106.00.
Exploring Analyst Ratings: An In-Depth Overview
The analysis of recent analyst actions sheds light on the perception of T. Rowe Price Group by financial experts. The following summary presents key analysts, their recent evaluations, and adjustments to ratings and price targets.
| Analyst | Analyst Firm | Action Taken | Rating | Current Price Target | Prior Price Target |
|---|---|---|---|---|---|
| Michael Cyprys | Morgan Stanley | Raises | Equal-Weight | $95.00 | $94.00 |
| Benjamin Budish | Barclays | Raises | Underweight | $90.00 | $85.00 |
| Kenneth Worthington | JP Morgan | Lowers | Underweight | $90.00 | $110.00 |
| Benjamin Budish | Barclays | Lowers | Underweight | $85.00 | $105.00 |
| Chris Allen | Citigroup | Lowers | Neutral | $95.00 | $100.00 |
| Alexander Blostein | Goldman Sachs | Lowers | Sell | $80.00 | $89.00 |
| Glenn Schorr | Evercore ISI Group | Lowers | In-Line | $80.00 | $104.00 |
| Bill Katz | TD Cowen | Lowers | Hold | $89.00 | $112.00 |
| Michael Brown | Wells Fargo | Lowers | Equal-Weight | $98.00 | $116.00 |
| Alexander Blostein | Goldman Sachs | Lowers | Sell | $89.00 | $103.00 |
| Craig Siegenthaler | B of A Securities | Lowers | Underperform | $85.00 | $90.00 |
| Chris Allen | Citigroup | Lowers | Neutral | $100.00 | $120.00 |
| Michael Cyprys | Morgan Stanley | Lowers | Equal-Weight | $121.00 | $126.00 |
| Aidan Hall | Keefe, Bruyette & Woods | Raises | Market Perform | $113.00 | $111.00 |
| Michael Brown | Wells Fargo | Lowers | Equal-Weight | $116.00 | $118.00 |
| Benjamin Budish | Barclays | Lowers | Underweight | $105.00 | $113.00 |
Key Insights:
- Action Taken: Responding to changing market dynamics and company performance, analysts update their recommendations. Whether they 'Maintain', 'Raise', or 'Lower' their stance, it signifies their response to recent developments related to T. Rowe Price Group. This offers insight into analysts' perspectives on the current state of the company.
- Rating: Delving into assessments, analysts assign qualitative values, from 'Outperform' to 'Underperform'. These ratings communicate expectations for the relative performance of T. Rowe Price Group compared to the broader market.
- Price Targets: Analysts gauge the dynamics of price targets, providing estimates for the future value of T. Rowe Price Group's stock. This comparison reveals trends in analysts' expectations over time.
Navigating through these analyst evaluations alongside other financial indicators can contribute to a holistic understanding of T. Rowe Price Group's market standing. Stay informed and make data-driven decisions with our Ratings Table.
Stay up to date on T. Rowe Price Group analyst ratings.
Get to Know T. Rowe Price Group Better
T. Rowe Price provides asset-management services for individual and institutional investors. It offers a broad range of no-load us and international stock, hybrid, bond, and money market funds. At the end of October 2024, the firm had $1.607 trillion in managed assets, composed of equity (51%), balanced (34%), fixed-income and money market (12%), and alternative (3%) offerings. Approximately two thirds of managed assets are held in retirement-based accounts, which provides T. Rowe Price with a somewhat stickier client base than most of its peers. The firm also manages private accounts, provides retirement planning advice, and offers discount brokerage and trust services. The company is primarily a us-based asset manager, deriving less than 10% of its AUM from overseas.
Key Indicators: T. Rowe Price Group's Financial Health
Market Capitalization: Indicating a reduced size compared to industry averages, the company's market capitalization poses unique challenges.
Revenue Growth: T. Rowe Price Group's revenue growth over a period of 3M has been noteworthy. As of 31 March, 2025, the company achieved a revenue growth rate of approximately 0.78%. This indicates a substantial increase in the company's top-line earnings. As compared to its peers, the revenue growth lags behind its industry peers. The company achieved a growth rate lower than the average among peers in Financials sector.
Net Margin: T. Rowe Price Group's net margin lags behind industry averages, suggesting challenges in maintaining strong profitability. With a net margin of 27.1%, the company may face hurdles in effective cost management.
Return on Equity (ROE): T. Rowe Price Group's ROE excels beyond industry benchmarks, reaching 4.61%. This signifies robust financial management and efficient use of shareholder equity capital.
Return on Assets (ROA): T. Rowe Price Group's financial strength is reflected in its exceptional ROA, which exceeds industry averages. With a remarkable ROA of 3.48%, the company showcases efficient use of assets and strong financial health.
Debt Management: The company maintains a balanced debt approach with a debt-to-equity ratio below industry norms, standing at 0.05.
How Are Analyst Ratings Determined?
Analysts work in banking and financial systems and typically specialize in reporting for stocks or defined sectors. Analysts may attend company conference calls and meetings, research company financial statements, and communicate with insiders to publish "analyst ratings" for stocks. Analysts typically rate each stock once per quarter.
Some analysts also offer predictions for helpful metrics such as earnings, revenue, and growth estimates to provide further guidance as to what to do with certain tickers. It is important to keep in mind that while stock and sector analysts are specialists, they are also human and can only forecast their beliefs to traders.
Which Stocks Are Analysts Recommending Now?
Benzinga Edge gives you instant access to all major analyst upgrades, downgrades, and price targets. Sort by accuracy, upside potential, and more. Click here to stay ahead of the market.
This article was generated by Benzinga's automated content engine and reviewed by an editor.