
Throughout the last three months, 12 analysts have evaluated Mohawk Industries (NYSE:MHK), offering a diverse set of opinions from bullish to bearish.
The following table provides a quick overview of their recent ratings, highlighting the changing sentiments over the past 30 days and comparing them to the preceding months.
| Bullish | Somewhat Bullish | Indifferent | Somewhat Bearish | Bearish | |
|---|---|---|---|---|---|
| Total Ratings | 4 | 2 | 6 | 0 | 0 |
| Last 30D | 0 | 0 | 2 | 0 | 0 |
| 1M Ago | 0 | 0 | 2 | 0 | 0 |
| 2M Ago | 0 | 0 | 0 | 0 | 0 |
| 3M Ago | 4 | 2 | 2 | 0 | 0 |
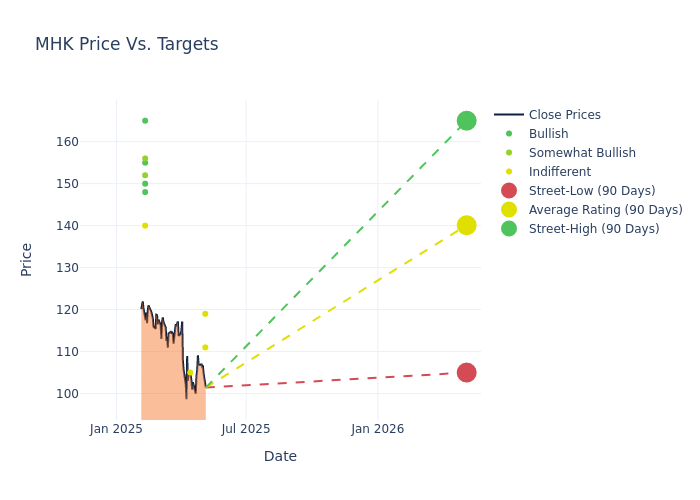
The 12-month price targets assessed by analysts reveal further insights, featuring an average target of $136.75, a high estimate of $165.00, and a low estimate of $105.00. This current average has decreased by 7.45% from the previous average price target of $147.75.
Deciphering Analyst Ratings: An In-Depth Analysis
The standing of Mohawk Industries among financial experts is revealed through an in-depth exploration of recent analyst actions. The summary below outlines key analysts, their recent evaluations, and adjustments to ratings and price targets.
| Analyst | Analyst Firm | Action Taken | Rating | Current Price Target | Prior Price Target |
|---|---|---|---|---|---|
| Matthew Bouley | Barclays | Lowers | Equal-Weight | $111.00 | $115.00 |
| Mike Dahl | RBC Capital | Lowers | Sector Perform | $119.00 | $130.00 |
| Sam Reid | Wells Fargo | Lowers | Equal-Weight | $105.00 | $130.00 |
| Matthew Bouley | Barclays | Lowers | Equal-Weight | $115.00 | $125.00 |
| Sam Darkatsh | Raymond James | Lowers | Strong Buy | $165.00 | $185.00 |
| Laura Champine | Loop Capital | Lowers | Buy | $155.00 | $180.00 |
| Michael Rehaut | JP Morgan | Lowers | Overweight | $156.00 | $161.00 |
| Stephen Kim | Evercore ISI Group | Lowers | In-Line | $140.00 | $150.00 |
| Keith Hughes | Truist Securities | Lowers | Buy | $148.00 | $155.00 |
| Matthew Bouley | Barclays | Lowers | Equal-Weight | $125.00 | $130.00 |
| Timothy Wojs | Baird | Lowers | Outperform | $152.00 | $160.00 |
| Rafe Jadrosich | B of A Securities | Lowers | Buy | $150.00 | $152.00 |
Key Insights:
- Action Taken: In response to dynamic market conditions and company performance, analysts update their recommendations. Whether they 'Maintain', 'Raise', or 'Lower' their stance, it signifies their reaction to recent developments related to Mohawk Industries. This insight gives a snapshot of analysts' perspectives on the current state of the company.
- Rating: Analysts assign qualitative assessments to stocks, ranging from 'Outperform' to 'Underperform'. These ratings convey the analysts' expectations for the relative performance of Mohawk Industries compared to the broader market.
- Price Targets: Analysts explore the dynamics of price targets, providing estimates for the future value of Mohawk Industries's stock. This examination reveals shifts in analysts' expectations over time.
To gain a panoramic view of Mohawk Industries's market performance, explore these analyst evaluations alongside essential financial indicators. Stay informed and make judicious decisions using our Ratings Table.
Stay up to date on Mohawk Industries analyst ratings.
Unveiling the Story Behind Mohawk Industries
Mohawk Industries Inc manufactures a wide range of flooring products, including carpets, rugs, ceramic tile, laminate, wood, luxury vinyl tile, and vinyl flooring. Its operating segments include Global Ceramic, Flooring North America, and Flooring Rest of the World. The company generates maximum revenue from the Global Ceramic segment. Geographically, it derives a majority of its revenue from the United States, while it also operates in Latin America, Europe and Others.
Unraveling the Financial Story of Mohawk Industries
Market Capitalization: Positioned above industry average, the company's market capitalization underscores its superiority in size, indicative of a strong market presence.
Negative Revenue Trend: Examining Mohawk Industries's financials over 3M reveals challenges. As of 31 March, 2025, the company experienced a decline of approximately -4.22% in revenue growth, reflecting a decrease in top-line earnings. In comparison to its industry peers, the company trails behind with a growth rate lower than the average among peers in the Consumer Discretionary sector.
Net Margin: Mohawk Industries's net margin is impressive, surpassing industry averages. With a net margin of 2.87%, the company demonstrates strong profitability and effective cost management.
Return on Equity (ROE): Mohawk Industries's ROE surpasses industry standards, highlighting the company's exceptional financial performance. With an impressive 0.94% ROE, the company effectively utilizes shareholder equity capital.
Return on Assets (ROA): Mohawk Industries's ROA excels beyond industry benchmarks, reaching 0.55%. This signifies efficient management of assets and strong financial health.
Debt Management: Mohawk Industries's debt-to-equity ratio is below the industry average. With a ratio of 0.35, the company relies less on debt financing, maintaining a healthier balance between debt and equity, which can be viewed positively by investors.
The Basics of Analyst Ratings
Within the domain of banking and financial systems, analysts specialize in reporting for specific stocks or defined sectors. Their work involves attending company conference calls and meetings, researching company financial statements, and communicating with insiders to publish "analyst ratings" for stocks. Analysts typically assess and rate each stock once per quarter.
Some analysts publish their predictions for metrics such as growth estimates, earnings, and revenue to provide additional guidance with their ratings. When using analyst ratings, it is important to keep in mind that stock and sector analysts are also human and are only offering their opinions to investors.
If you want to keep track of which analysts are outperforming others, you can view updated analyst ratings along withanalyst success scores in Benzinga Pro.
Which Stocks Are Analysts Recommending Now?
Benzinga Edge gives you instant access to all major analyst upgrades, downgrades, and price targets. Sort by accuracy, upside potential, and more. Click here to stay ahead of the market.
This article was generated by Benzinga's automated content engine and reviewed by an editor.