
Penske Automotive Group (NYSE:PAG) has been analyzed by 5 analysts in the last three months, revealing a diverse range of perspectives from bullish to bearish.
The following table encapsulates their recent ratings, offering a glimpse into the evolving sentiments over the past 30 days and comparing them to the preceding months.
| Bullish | Somewhat Bullish | Indifferent | Somewhat Bearish | Bearish | |
|---|---|---|---|---|---|
| Total Ratings | 1 | 0 | 2 | 2 | 0 |
| Last 30D | 0 | 0 | 1 | 0 | 0 |
| 1M Ago | 1 | 0 | 0 | 0 | 0 |
| 2M Ago | 0 | 0 | 0 | 1 | 0 |
| 3M Ago | 0 | 0 | 1 | 1 | 0 |
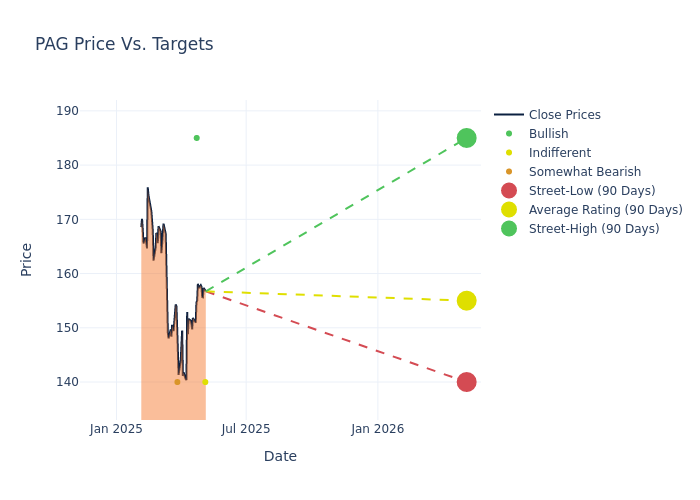
The 12-month price targets, analyzed by analysts, offer insights with an average target of $159.0, a high estimate of $185.00, and a low estimate of $140.00. This current average has increased by 0.95% from the previous average price target of $157.50.
Breaking Down Analyst Ratings: A Detailed Examination
The perception of Penske Automotive Group by financial experts is analyzed through recent analyst actions. The following summary presents key analysts, their recent evaluations, and adjustments to ratings and price targets.
| Analyst | Analyst Firm | Action Taken | Rating | Current Price Target | Prior Price Target |
|---|---|---|---|---|---|
| Jeff Lick | Stephens & Co. | Maintains | Equal-Weight | $140.00 | $140.00 |
| Michael Ward | Citigroup | Announces | Buy | $185.00 | - |
| Rajat Gupta | JP Morgan | Lowers | Underweight | $140.00 | $165.00 |
| Rajat Gupta | JP Morgan | Raises | Underweight | $165.00 | $160.00 |
| Jeff Lick | Stephens & Co. | Maintains | Equal-Weight | $165.00 | $165.00 |
Key Insights:
- Action Taken: Responding to changing market dynamics and company performance, analysts update their recommendations. Whether they 'Maintain', 'Raise', or 'Lower' their stance, it signifies their response to recent developments related to Penske Automotive Group. This offers insight into analysts' perspectives on the current state of the company.
- Rating: Offering insights into predictions, analysts assign qualitative values, from 'Outperform' to 'Underperform'. These ratings convey expectations for the relative performance of Penske Automotive Group compared to the broader market.
- Price Targets: Analysts provide insights into price targets, offering estimates for the future value of Penske Automotive Group's stock. This comparison reveals trends in analysts' expectations over time.
For valuable insights into Penske Automotive Group's market performance, consider these analyst evaluations alongside crucial financial indicators. Stay well-informed and make prudent decisions using our Ratings Table.
Stay up to date on Penske Automotive Group analyst ratings.
Get to Know Penske Automotive Group Better
Penske Automotive Group operates in 19 US states and overseas. It has over 150 US and Puerto Rico light-vehicle stores as well as 210 franchised dealerships overseas, primarily in the United Kingdom but also in Australia, Germany, Italy, and Japan. The company is the third-largest US publicly traded dealership in terms of light-vehicle revenue and sells more than 40 brands, with over 90% of retail automotive revenue coming from luxury and import names. Other segments are service and finance and insurance. The firm's Premier Truck Group owns 45 truck dealerships selling mostly Freightliner and Western Star brands, and Penske owns 16 used-vehicle stores, mostly in the US and UK under the CarShop (US) and Sytner Select (UK) brands. Penske is based in Bloomfield Hills, Michigan.
Key Indicators: Penske Automotive Group's Financial Health
Market Capitalization Analysis: The company's market capitalization is above the industry average, indicating that it is relatively larger in size compared to peers. This may suggest a higher level of investor confidence and market recognition.
Revenue Growth: Penske Automotive Group's remarkable performance in 3M is evident. As of 31 March, 2025, the company achieved an impressive revenue growth rate of 2.1%. This signifies a substantial increase in the company's top-line earnings. In comparison to its industry peers, the company trails behind with a growth rate lower than the average among peers in the Consumer Discretionary sector.
Net Margin: Penske Automotive Group's net margin surpasses industry standards, highlighting the company's exceptional financial performance. With an impressive 3.21% net margin, the company effectively manages costs and achieves strong profitability.
Return on Equity (ROE): Penske Automotive Group's financial strength is reflected in its exceptional ROE, which exceeds industry averages. With a remarkable ROE of 4.61%, the company showcases efficient use of equity capital and strong financial health.
Return on Assets (ROA): Penske Automotive Group's ROA surpasses industry standards, highlighting the company's exceptional financial performance. With an impressive 1.45% ROA, the company effectively utilizes its assets for optimal returns.
Debt Management: Penske Automotive Group's debt-to-equity ratio is below the industry average at 1.5, reflecting a lower dependency on debt financing and a more conservative financial approach.
What Are Analyst Ratings?
Experts in banking and financial systems, analysts specialize in reporting for specific stocks or defined sectors. Their comprehensive research involves attending company conference calls and meetings, analyzing financial statements, and engaging with insiders to generate what are known as analyst ratings for stocks. Typically, analysts assess and rate each stock once per quarter.
Analysts may enhance their evaluations by incorporating forecasts for metrics like growth estimates, earnings, and revenue, delivering additional guidance to investors. It is vital to acknowledge that, although experts in stocks and sectors, analysts are human and express their opinions when providing insights.
Which Stocks Are Analysts Recommending Now?
Benzinga Edge gives you instant access to all major analyst upgrades, downgrades, and price targets. Sort by accuracy, upside potential, and more. Click here to stay ahead of the market.
This article was generated by Benzinga's automated content engine and reviewed by an editor.