
The worst result, after buying shares in a company (assuming no leverage), would be if you lose all the money you put in. But when you pick a company that is really flourishing, you can make more than 100%. To wit, the Erie Indemnity Company (NASDAQ:ERIE) share price has flown 120% in the last three years. Most would be happy with that. Better yet, the share price has risen 4.9% in the last week. But this could be related to the buoyant market which is up about 2.8% in a week.
Since the stock has added US$888m to its market cap in the past week alone, let's see if underlying performance has been driving long-term returns.
We check all companies for important risks. See what we found for Erie Indemnity in our free report.In his essay The Superinvestors of Graham-and-Doddsville Warren Buffett described how share prices do not always rationally reflect the value of a business. One way to examine how market sentiment has changed over time is to look at the interaction between a company's share price and its earnings per share (EPS).
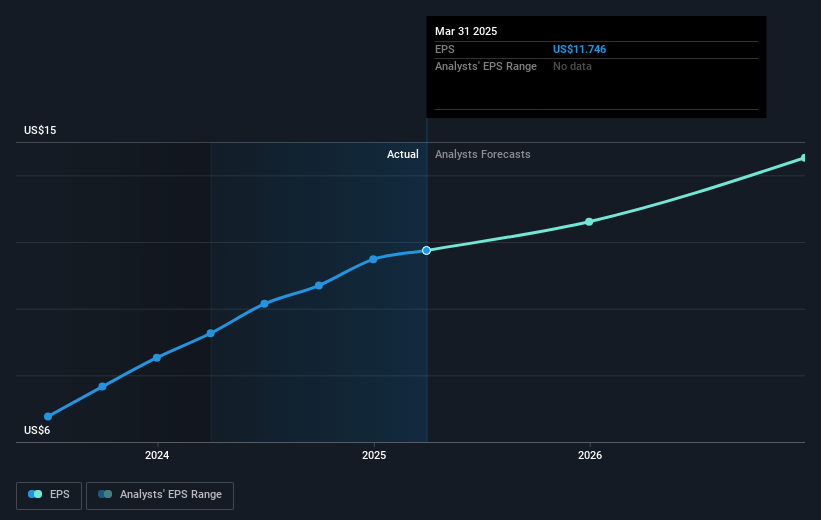
During three years of share price growth, Erie Indemnity achieved compound earnings per share growth of 28% per year. We note that the 30% yearly (average) share price gain isn't too far from the EPS growth rate. Coincidence? Probably not. This suggests that sentiment and expectations have not changed drastically. Rather, the share price has approximately tracked EPS growth.
The graphic below depicts how EPS has changed over time (unveil the exact values by clicking on the image).
We know that Erie Indemnity has improved its bottom line lately, but is it going to grow revenue? Check if analysts think Erie Indemnity will grow revenue in the future.
What About Dividends?
When looking at investment returns, it is important to consider the difference between total shareholder return (TSR) and share price return. The TSR incorporates the value of any spin-offs or discounted capital raisings, along with any dividends, based on the assumption that the dividends are reinvested. So for companies that pay a generous dividend, the TSR is often a lot higher than the share price return. As it happens, Erie Indemnity's TSR for the last 3 years was 131%, which exceeds the share price return mentioned earlier. The dividends paid by the company have thusly boosted the total shareholder return.
A Different Perspective
Investors in Erie Indemnity had a tough year, with a total loss of 7.9% (including dividends), against a market gain of about 11%. However, keep in mind that even the best stocks will sometimes underperform the market over a twelve month period. Longer term investors wouldn't be so upset, since they would have made 18%, each year, over five years. If the fundamental data continues to indicate long term sustainable growth, the current sell-off could be an opportunity worth considering. If you would like to research Erie Indemnity in more detail then you might want to take a look at whether insiders have been buying or selling shares in the company.
Of course, you might find a fantastic investment by looking elsewhere. So take a peek at this free list of companies we expect will grow earnings.
Please note, the market returns quoted in this article reflect the market weighted average returns of stocks that currently trade on American exchanges.
Have feedback on this article? Concerned about the content? Get in touch with us directly. Alternatively, email editorial-team (at) simplywallst.com.
This article by Simply Wall St is general in nature. We provide commentary based on historical data and analyst forecasts only using an unbiased methodology and our articles are not intended to be financial advice. It does not constitute a recommendation to buy or sell any stock, and does not take account of your objectives, or your financial situation. We aim to bring you long-term focused analysis driven by fundamental data. Note that our analysis may not factor in the latest price-sensitive company announcements or qualitative material. Simply Wall St has no position in any stocks mentioned.