
In the latest quarter, 10 analysts provided ratings for Patrick Industries (NASDAQ:PATK), showcasing a mix of bullish and bearish perspectives.
The following table summarizes their recent ratings, shedding light on the changing sentiments within the past 30 days and comparing them to the preceding months.
| Bullish | Somewhat Bullish | Indifferent | Somewhat Bearish | Bearish | |
|---|---|---|---|---|---|
| Total Ratings | 4 | 4 | 2 | 0 | 0 |
| Last 30D | 1 | 1 | 1 | 0 | 0 |
| 1M Ago | 1 | 1 | 1 | 0 | 0 |
| 2M Ago | 0 | 0 | 0 | 0 | 0 |
| 3M Ago | 2 | 2 | 0 | 0 | 0 |
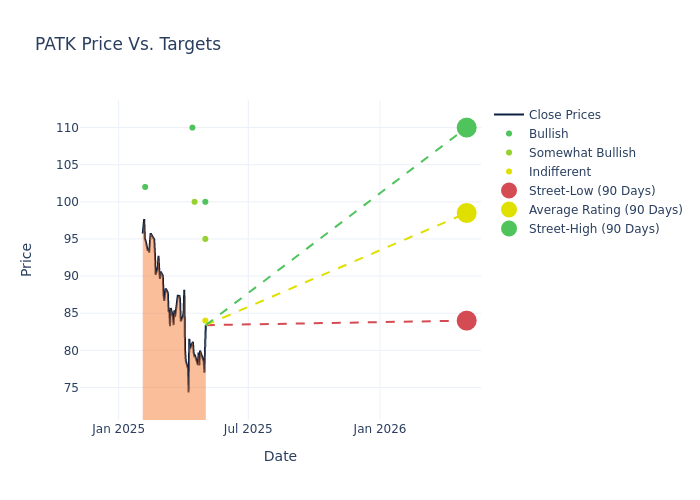
Analysts provide deeper insights through their assessments of 12-month price targets, revealing an average target of $102.0, a high estimate of $120.00, and a low estimate of $84.00. This current average has decreased by 3.13% from the previous average price target of $105.30.
Breaking Down Analyst Ratings: A Detailed Examination
The perception of Patrick Industries by financial experts is analyzed through recent analyst actions. The following summary presents key analysts, their recent evaluations, and adjustments to ratings and price targets.
| Analyst | Analyst Firm | Action Taken | Rating | Current Price Target | Prior Price Target |
|---|---|---|---|---|---|
| Scott Stember | Roth MKM | Lowers | Buy | $100.00 | $112.00 |
| Joseph Altobello | Raymond James | Lowers | Outperform | $95.00 | $103.00 |
| Craig Kennison | Baird | Lowers | Neutral | $84.00 | $96.00 |
| Eric Heath | Keybanc | Lowers | Overweight | $100.00 | $110.00 |
| Michael Swartz | Truist Securities | Lowers | Buy | $110.00 | $120.00 |
| Craig Kennison | Baird | Lowers | Neutral | $96.00 | $100.00 |
| Michael Swartz | Truist Securities | Raises | Buy | $120.00 | $115.00 |
| Michael Albanese | Benchmark | Raises | Buy | $102.00 | $98.00 |
| Joseph Altobello | Raymond James | Raises | Outperform | $103.00 | $99.00 |
| Noah Zatzkin | Keybanc | Raises | Overweight | $110.00 | $100.00 |
Key Insights:
- Action Taken: Responding to changing market dynamics and company performance, analysts update their recommendations. Whether they 'Maintain', 'Raise', or 'Lower' their stance, it signifies their response to recent developments related to Patrick Industries. This offers insight into analysts' perspectives on the current state of the company.
- Rating: Providing a comprehensive analysis, analysts offer qualitative assessments, ranging from 'Outperform' to 'Underperform'. These ratings reflect expectations for the relative performance of Patrick Industries compared to the broader market.
- Price Targets: Analysts navigate through adjustments in price targets, providing estimates for Patrick Industries's future value. Comparing current and prior targets offers insights into analysts' evolving expectations.
Analyzing these analyst evaluations alongside relevant financial metrics can provide a comprehensive view of Patrick Industries's market position. Stay informed and make data-driven decisions with the assistance of our Ratings Table.
Stay up to date on Patrick Industries analyst ratings.
Delving into Patrick Industries's Background
Patrick Industries Inc makes and sells building products and materials for recreational vehicles and manufactured housing. The company is organized into two segments based on product type: manufacturing and distribution. The manufacturing segment, which generates the majority of revenue, sells laminated and vinyl products that include furniture, shelving, cabinets, bath fixtures, and countertops. The distribution segment sells prefinished wall and ceiling panels, as well as electrical and plumbing products for the RV and manufactured housing industries. One of the firm's RV customers makes up a portion of revenue.
Understanding the Numbers: Patrick Industries's Finances
Market Capitalization: Positioned above industry average, the company's market capitalization underscores its superiority in size, indicative of a strong market presence.
Revenue Growth: Over the 3M period, Patrick Industries showcased positive performance, achieving a revenue growth rate of 8.31% as of 31 December, 2024. This reflects a substantial increase in the company's top-line earnings. In comparison to its industry peers, the company stands out with a growth rate higher than the average among peers in the Consumer Discretionary sector.
Net Margin: Patrick Industries's net margin excels beyond industry benchmarks, reaching 1.72%. This signifies efficient cost management and strong financial health.
Return on Equity (ROE): The company's ROE is a standout performer, exceeding industry averages. With an impressive ROE of 1.29%, the company showcases effective utilization of equity capital.
Return on Assets (ROA): Patrick Industries's financial strength is reflected in its exceptional ROA, which exceeds industry averages. With a remarkable ROA of 0.47%, the company showcases efficient use of assets and strong financial health.
Debt Management: With a high debt-to-equity ratio of 1.35, Patrick Industries faces challenges in effectively managing its debt levels, indicating potential financial strain.
Analyst Ratings: What Are They?
Benzinga tracks 150 analyst firms and reports on their stock expectations. Analysts typically arrive at their conclusions by predicting how much money a company will make in the future, usually the upcoming five years, and how risky or predictable that company's revenue streams are.
Analysts attend company conference calls and meetings, research company financial statements, and communicate with insiders to publish their ratings on stocks. Analysts typically rate each stock once per quarter or whenever the company has a major update.
In addition to their assessments, some analysts extend their insights by offering predictions for key metrics such as earnings, revenue, and growth estimates. This supplementary information provides further guidance for traders. It is crucial to recognize that, despite their specialization, analysts are human and can only provide forecasts based on their beliefs.
Which Stocks Are Analysts Recommending Now?
Benzinga Edge gives you instant access to all major analyst upgrades, downgrades, and price targets. Sort by accuracy, upside potential, and more. Click here to stay ahead of the market.
This article was generated by Benzinga's automated content engine and reviewed by an editor.