
Despite an already strong run, Vision Values Holdings Limited (HKG:862) shares have been powering on, with a gain of 42% in the last thirty days. The annual gain comes to 110% following the latest surge, making investors sit up and take notice.
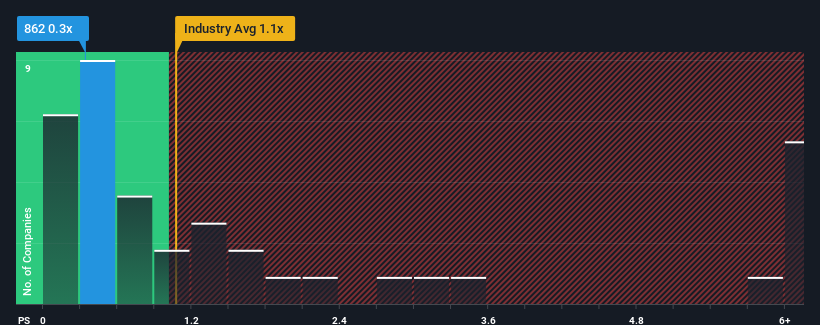
In spite of the firm bounce in price, Vision Values Holdings may still be sending buy signals at present with its price-to-sales (or "P/S") ratio of 0.3x, considering almost half of all companies in the IT industry in Hong Kong have P/S ratios greater than 1.1x and even P/S higher than 4x aren't out of the ordinary. Although, it's not wise to just take the P/S at face value as there may be an explanation why it's limited.
See our latest analysis for Vision Values Holdings
How Vision Values Holdings Has Been Performing
Revenue has risen at a steady rate over the last year for Vision Values Holdings, which is generally not a bad outcome. It might be that many expect the respectable revenue performance to degrade, which has repressed the P/S. Those who are bullish on Vision Values Holdings will be hoping that this isn't the case, so that they can pick up the stock at a lower valuation.
Although there are no analyst estimates available for Vision Values Holdings, take a look at this free data-rich visualisation to see how the company stacks up on earnings, revenue and cash flow.How Is Vision Values Holdings' Revenue Growth Trending?
In order to justify its P/S ratio, Vision Values Holdings would need to produce sluggish growth that's trailing the industry.
If we review the last year of revenue growth, the company posted a worthy increase of 7.4%. Spectacularly, three year revenue growth has ballooned by several orders of magnitude, even though the last 12 months were fairly tame in comparison. Therefore, it's fair to say the revenue growth recently has been superb for the company.
Comparing that recent medium-term revenue trajectory with the industry's one-year growth forecast of 9.6% shows it's noticeably more attractive.
With this information, we find it odd that Vision Values Holdings is trading at a P/S lower than the industry. It looks like most investors are not convinced the company can maintain its recent growth rates.
The Bottom Line On Vision Values Holdings' P/S
The latest share price surge wasn't enough to lift Vision Values Holdings' P/S close to the industry median. We'd say the price-to-sales ratio's power isn't primarily as a valuation instrument but rather to gauge current investor sentiment and future expectations.
We're very surprised to see Vision Values Holdings currently trading on a much lower than expected P/S since its recent three-year growth is higher than the wider industry forecast. When we see strong revenue with faster-than-industry growth, we assume there are some significant underlying risks to the company's ability to make money which is applying downwards pressure on the P/S ratio. At least price risks look to be very low if recent medium-term revenue trends continue, but investors seem to think future revenue could see a lot of volatility.
It is also worth noting that we have found 2 warning signs for Vision Values Holdings (1 shouldn't be ignored!) that you need to take into consideration.
If companies with solid past earnings growth is up your alley, you may wish to see this free collection of other companies with strong earnings growth and low P/E ratios.
Have feedback on this article? Concerned about the content? Get in touch with us directly. Alternatively, email editorial-team (at) simplywallst.com.
This article by Simply Wall St is general in nature. We provide commentary based on historical data and analyst forecasts only using an unbiased methodology and our articles are not intended to be financial advice. It does not constitute a recommendation to buy or sell any stock, and does not take account of your objectives, or your financial situation. We aim to bring you long-term focused analysis driven by fundamental data. Note that our analysis may not factor in the latest price-sensitive company announcements or qualitative material. Simply Wall St has no position in any stocks mentioned.