
Blue Moon Group Holdings (HKG:6993) Full Year 2024 Results
Key Financial Results
- Revenue: HK$8.56b (up 17% from FY 2023).
- Net loss: HK$749.3m (down by 330% from HK$325.3m profit in FY 2023).
- HK$0.14 loss per share (down from HK$0.058 profit in FY 2023).
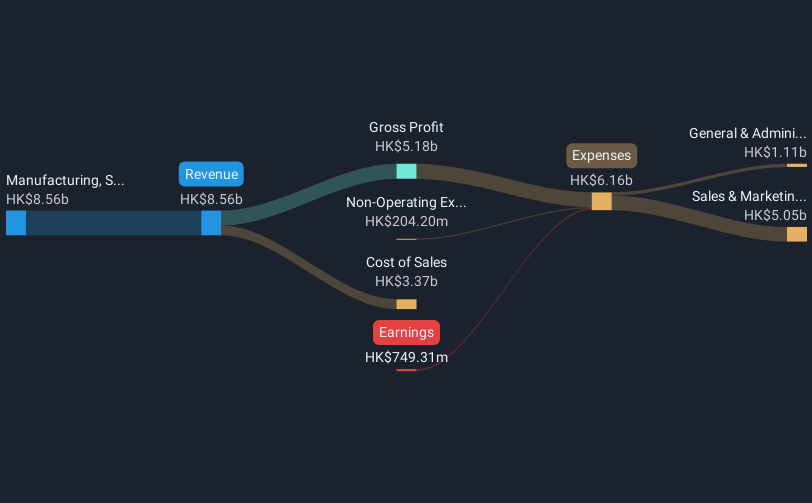
All figures shown in the chart above are for the trailing 12 month (TTM) period
Blue Moon Group Holdings EPS Misses Expectations
Revenue was in line with analyst estimates. Earnings per share (EPS) missed analyst estimates by 50%.
In the last 12 months, the only revenue segment was Manufacturing, Selling And Distribution Of Cleaning Products contributing HK$8.56b. The largest operating expense was Sales & Marketing costs, amounting to HK$5.05b (82% of total expenses). Over the last 12 months, the company's earnings were enhanced by non-operating gains of HK$204.2m. Explore how 6993's revenue and expenses shape its earnings.
Looking ahead, revenue is forecast to grow 6.5% p.a. on average during the next 3 years, compared to a 6.0% growth forecast for the Household Products industry in Asia.
Performance of the market in Hong Kong.
The company's shares are up 3.6% from a week ago.
Risk Analysis
We don't want to rain on the parade too much, but we did also find 1 warning sign for Blue Moon Group Holdings that you need to be mindful of.
Have feedback on this article? Concerned about the content? Get in touch with us directly. Alternatively, email editorial-team (at) simplywallst.com.
This article by Simply Wall St is general in nature. We provide commentary based on historical data and analyst forecasts only using an unbiased methodology and our articles are not intended to be financial advice. It does not constitute a recommendation to buy or sell any stock, and does not take account of your objectives, or your financial situation. We aim to bring you long-term focused analysis driven by fundamental data. Note that our analysis may not factor in the latest price-sensitive company announcements or qualitative material. Simply Wall St has no position in any stocks mentioned.