
Most readers would already be aware that Giordano International's (HKG:709) stock increased significantly by 10% over the past week. As most would know, fundamentals are what usually guide market price movements over the long-term, so we decided to look at the company's key financial indicators today to determine if they have any role to play in the recent price movement. In this article, we decided to focus on Giordano International's ROE.
Return on equity or ROE is an important factor to be considered by a shareholder because it tells them how effectively their capital is being reinvested. Simply put, it is used to assess the profitability of a company in relation to its equity capital.
How To Calculate Return On Equity?
Return on equity can be calculated by using the formula:
Return on Equity = Net Profit (from continuing operations) ÷ Shareholders' Equity
So, based on the above formula, the ROE for Giordano International is:
12% = HK$252m ÷ HK$2.1b (Based on the trailing twelve months to December 2024).
The 'return' is the amount earned after tax over the last twelve months. Another way to think of that is that for every HK$1 worth of equity, the company was able to earn HK$0.12 in profit.
See our latest analysis for Giordano International
Why Is ROE Important For Earnings Growth?
Thus far, we have learned that ROE measures how efficiently a company is generating its profits. Based on how much of its profits the company chooses to reinvest or "retain", we are then able to evaluate a company's future ability to generate profits. Assuming everything else remains unchanged, the higher the ROE and profit retention, the higher the growth rate of a company compared to companies that don't necessarily bear these characteristics.
A Side By Side comparison of Giordano International's Earnings Growth And 12% ROE
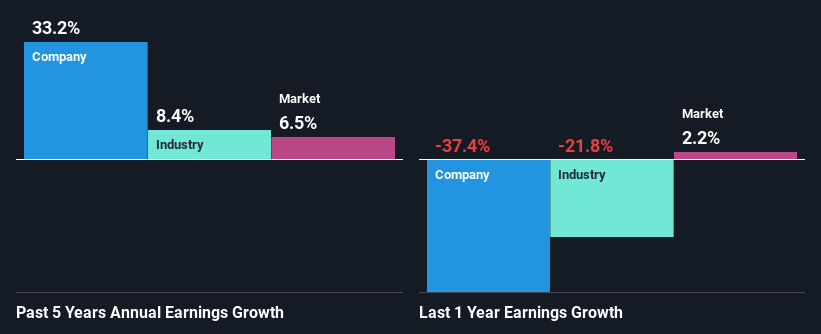
At first glance, Giordano International seems to have a decent ROE. Especially when compared to the industry average of 9.8% the company's ROE looks pretty impressive. This probably laid the ground for Giordano International's significant 33% net income growth seen over the past five years. However, there could also be other causes behind this growth. For instance, the company has a low payout ratio or is being managed efficiently.
We then compared Giordano International's net income growth with the industry and we're pleased to see that the company's growth figure is higher when compared with the industry which has a growth rate of 8.4% in the same 5-year period.
Earnings growth is a huge factor in stock valuation. What investors need to determine next is if the expected earnings growth, or the lack of it, is already built into the share price. By doing so, they will have an idea if the stock is headed into clear blue waters or if swampy waters await. One good indicator of expected earnings growth is the P/E ratio which determines the price the market is willing to pay for a stock based on its earnings prospects. So, you may want to check if Giordano International is trading on a high P/E or a low P/E, relative to its industry.
Is Giordano International Making Efficient Use Of Its Profits?
Giordano International has very a high three-year median payout ratio of 135% suggesting that the company's shareholders are getting paid from more than just the company's earnings. However, this hasn't hampered its ability to grow as we saw earlier. Having said that, the high payout ratio is definitely risky and something to keep an eye on. To know the 2 risks we have identified for Giordano International visit our risks dashboard for free.
Additionally, Giordano International has paid dividends over a period of at least ten years which means that the company is pretty serious about sharing its profits with shareholders.
Conclusion
Overall, we feel that Giordano International certainly does have some positive factors to consider. Namely, its high earnings growth, which was likely due to its high ROE. However, investors could have benefitted even more from the high ROE, had the company been reinvesting more of its earnings. As discussed earlier, the company is retaining hardly any of its profits. With that said, the latest industry analyst forecasts reveal that the company's earnings growth is expected to slow down. To know more about the latest analysts predictions for the company, check out this visualization of analyst forecasts for the company.
Have feedback on this article? Concerned about the content? Get in touch with us directly. Alternatively, email editorial-team (at) simplywallst.com.
This article by Simply Wall St is general in nature. We provide commentary based on historical data and analyst forecasts only using an unbiased methodology and our articles are not intended to be financial advice. It does not constitute a recommendation to buy or sell any stock, and does not take account of your objectives, or your financial situation. We aim to bring you long-term focused analysis driven by fundamental data. Note that our analysis may not factor in the latest price-sensitive company announcements or qualitative material. Simply Wall St has no position in any stocks mentioned.