
A lackluster earnings announcement from ZJLD Group Inc (HKG:6979) last week didn't sink the stock price. Our analysis suggests that along with soft profit numbers, investors should be aware of some other underlying weaknesses in the numbers.
Our free stock report includes 3 warning signs investors should be aware of before investing in ZJLD Group. Read for free now.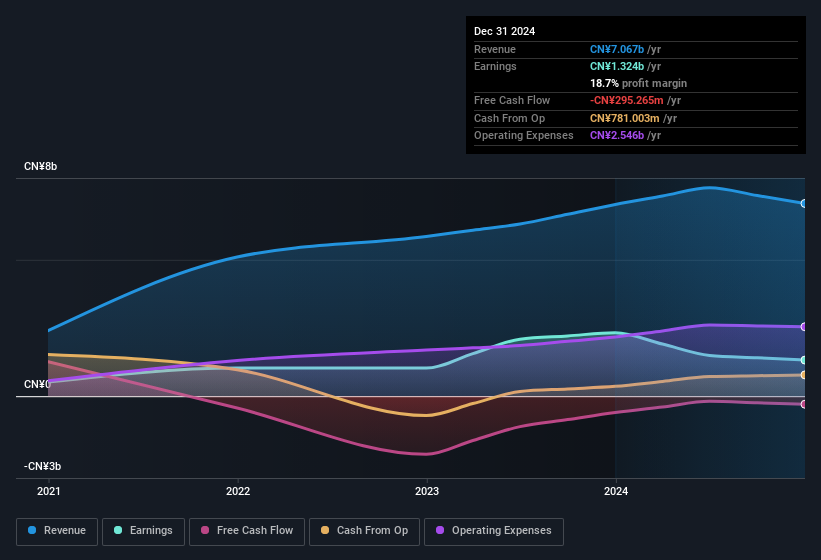
A Closer Look At ZJLD Group's Earnings
As finance nerds would already know, the accrual ratio from cashflow is a key measure for assessing how well a company's free cash flow (FCF) matches its profit. To get the accrual ratio we first subtract FCF from profit for a period, and then divide that number by the average operating assets for the period. This ratio tells us how much of a company's profit is not backed by free cashflow.
Therefore, it's actually considered a good thing when a company has a negative accrual ratio, but a bad thing if its accrual ratio is positive. That is not intended to imply we should worry about a positive accrual ratio, but it's worth noting where the accrual ratio is rather high. To quote a 2014 paper by Lewellen and Resutek, "firms with higher accruals tend to be less profitable in the future".
For the year to December 2024, ZJLD Group had an accrual ratio of 0.22. Therefore, we know that it's free cashflow was significantly lower than its statutory profit, which is hardly a good thing. In the last twelve months it actually had negative free cash flow, with an outflow of CN¥295m despite its profit of CN¥1.32b, mentioned above. Coming off the back of negative free cash flow last year, we imagine some shareholders might wonder if its cash burn of CN¥295m, this year, indicates high risk.
That might leave you wondering what analysts are forecasting in terms of future profitability. Luckily, you can click here to see an interactive graph depicting future profitability, based on their estimates.
Our Take On ZJLD Group's Profit Performance
ZJLD Group's accrual ratio for the last twelve months signifies cash conversion is less than ideal, which is a negative when it comes to our view of its earnings. Because of this, we think that it may be that ZJLD Group's statutory profits are better than its underlying earnings power. In further bad news, its earnings per share decreased in the last year. Of course, we've only just scratched the surface when it comes to analysing its earnings; one could also consider margins, forecast growth, and return on investment, among other factors. In light of this, if you'd like to do more analysis on the company, it's vital to be informed of the risks involved. Case in point: We've spotted 3 warning signs for ZJLD Group you should be mindful of and 1 of them makes us a bit uncomfortable.
Today we've zoomed in on a single data point to better understand the nature of ZJLD Group's profit. But there is always more to discover if you are capable of focussing your mind on minutiae. For example, many people consider a high return on equity as an indication of favorable business economics, while others like to 'follow the money' and search out stocks that insiders are buying. While it might take a little research on your behalf, you may find this free collection of companies boasting high return on equity, or this list of stocks with significant insider holdings to be useful.
Have feedback on this article? Concerned about the content? Get in touch with us directly. Alternatively, email editorial-team (at) simplywallst.com.
This article by Simply Wall St is general in nature. We provide commentary based on historical data and analyst forecasts only using an unbiased methodology and our articles are not intended to be financial advice. It does not constitute a recommendation to buy or sell any stock, and does not take account of your objectives, or your financial situation. We aim to bring you long-term focused analysis driven by fundamental data. Note that our analysis may not factor in the latest price-sensitive company announcements or qualitative material. Simply Wall St has no position in any stocks mentioned.