
Blue Moon Group Holdings Limited (HKG:6993) shareholders would be excited to see that the share price has had a great month, posting a 26% gain and recovering from prior weakness. Looking back a bit further, it's encouraging to see the stock is up 80% in the last year.
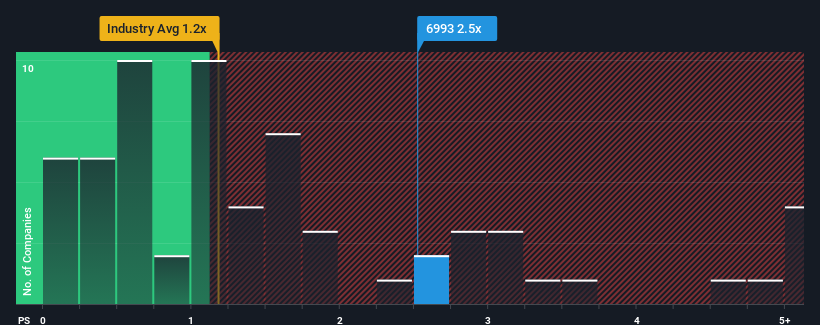
Since its price has surged higher, when almost half of the companies in Hong Kong's Household Products industry have price-to-sales ratios (or "P/S") below 0.4x, you may consider Blue Moon Group Holdings as a stock not worth researching with its 2.5x P/S ratio. Nonetheless, we'd need to dig a little deeper to determine if there is a rational basis for the highly elevated P/S.
Our free stock report includes 1 warning sign investors should be aware of before investing in Blue Moon Group Holdings. Read for free now.View our latest analysis for Blue Moon Group Holdings
How Blue Moon Group Holdings Has Been Performing
Recent revenue growth for Blue Moon Group Holdings has been in line with the industry. One possibility is that the P/S ratio is high because investors think this modest revenue performance will accelerate. If not, then existing shareholders may be a little nervous about the viability of the share price.
Keen to find out how analysts think Blue Moon Group Holdings' future stacks up against the industry? In that case, our free report is a great place to start.Is There Enough Revenue Growth Forecasted For Blue Moon Group Holdings?
Blue Moon Group Holdings' P/S ratio would be typical for a company that's expected to deliver very strong growth, and importantly, perform much better than the industry.
If we review the last year of revenue growth, the company posted a terrific increase of 17%. As a result, it also grew revenue by 13% in total over the last three years. Therefore, it's fair to say the revenue growth recently has been respectable for the company.
Turning to the outlook, the next three years should generate growth of 7.1% per annum as estimated by the five analysts watching the company. That's shaping up to be materially higher than the 4.6% each year growth forecast for the broader industry.
With this in mind, it's not hard to understand why Blue Moon Group Holdings' P/S is high relative to its industry peers. It seems most investors are expecting this strong future growth and are willing to pay more for the stock.
What Does Blue Moon Group Holdings' P/S Mean For Investors?
The strong share price surge has lead to Blue Moon Group Holdings' P/S soaring as well. Using the price-to-sales ratio alone to determine if you should sell your stock isn't sensible, however it can be a practical guide to the company's future prospects.
Our look into Blue Moon Group Holdings shows that its P/S ratio remains high on the merit of its strong future revenues. It appears that shareholders are confident in the company's future revenues, which is propping up the P/S. Unless the analysts have really missed the mark, these strong revenue forecasts should keep the share price buoyant.
There are also other vital risk factors to consider before investing and we've discovered 1 warning sign for Blue Moon Group Holdings that you should be aware of.
If companies with solid past earnings growth is up your alley, you may wish to see this free collection of other companies with strong earnings growth and low P/E ratios.
Have feedback on this article? Concerned about the content? Get in touch with us directly. Alternatively, email editorial-team (at) simplywallst.com.
This article by Simply Wall St is general in nature. We provide commentary based on historical data and analyst forecasts only using an unbiased methodology and our articles are not intended to be financial advice. It does not constitute a recommendation to buy or sell any stock, and does not take account of your objectives, or your financial situation. We aim to bring you long-term focused analysis driven by fundamental data. Note that our analysis may not factor in the latest price-sensitive company announcements or qualitative material. Simply Wall St has no position in any stocks mentioned.