
Key Insights
- The considerable ownership by private companies in Sinopharm Group indicates that they collectively have a greater say in management and business strategy
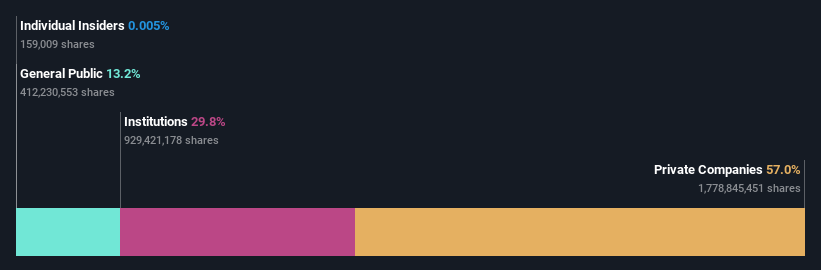
- 57% of the company is held by a single shareholder (China National Pharmaceutical Group Corporation)
- 30% of Sinopharm Group is held by Institutions
To get a sense of who is truly in control of Sinopharm Group Co. Ltd. (HKG:1099), it is important to understand the ownership structure of the business. With 57% stake, private companies possess the maximum shares in the company. Put another way, the group faces the maximum upside potential (or downside risk).
And institutions on the other hand have a 30% ownership in the company. Insiders often own a large chunk of younger, smaller, companies while huge companies tend to have institutions as shareholders.
Let's delve deeper into each type of owner of Sinopharm Group, beginning with the chart below.
Check out our latest analysis for Sinopharm Group
What Does The Institutional Ownership Tell Us About Sinopharm Group?
Many institutions measure their performance against an index that approximates the local market. So they usually pay more attention to companies that are included in major indices.
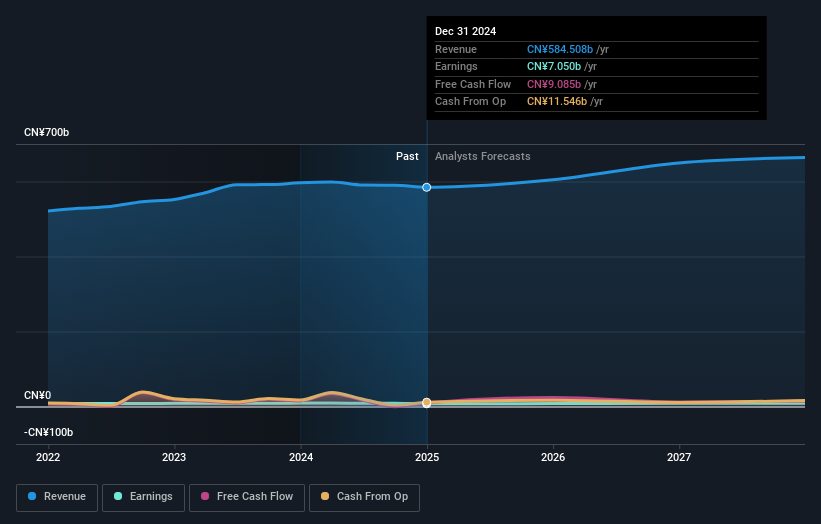
As you can see, institutional investors have a fair amount of stake in Sinopharm Group. This can indicate that the company has a certain degree of credibility in the investment community. However, it is best to be wary of relying on the supposed validation that comes with institutional investors. They too, get it wrong sometimes. It is not uncommon to see a big share price drop if two large institutional investors try to sell out of a stock at the same time. So it is worth checking the past earnings trajectory of Sinopharm Group, (below). Of course, keep in mind that there are other factors to consider, too.
Sinopharm Group is not owned by hedge funds. Our data shows that China National Pharmaceutical Group Corporation is the largest shareholder with 57% of shares outstanding. This essentially means that they have extensive influence, if not outright control, over the future of the corporation. With 4.8% and 4.3% of the shares outstanding respectively, FMR LLC and CITIC Securities Company Limited, Asset Management Arm are the second and third largest shareholders.
While it makes sense to study institutional ownership data for a company, it also makes sense to study analyst sentiments to know which way the wind is blowing. There are plenty of analysts covering the stock, so it might be worth seeing what they are forecasting, too.
Insider Ownership Of Sinopharm Group
The definition of company insiders can be subjective and does vary between jurisdictions. Our data reflects individual insiders, capturing board members at the very least. Management ultimately answers to the board. However, it is not uncommon for managers to be executive board members, especially if they are a founder or the CEO.
Insider ownership is positive when it signals leadership are thinking like the true owners of the company. However, high insider ownership can also give immense power to a small group within the company. This can be negative in some circumstances.
Our most recent data indicates that insiders own less than 1% of Sinopharm Group Co. Ltd.. We do note, however, it is possible insiders have an indirect interest through a private company or other corporate structure. It's a big company, so even a small proportional interest can create alignment between the board and shareholders. In this case insiders own HK$2.8m worth of shares. Arguably, recent buying and selling is just as important to consider. You can click here to see if insiders have been buying or selling.
General Public Ownership
The general public, who are usually individual investors, hold a 13% stake in Sinopharm Group. While this size of ownership may not be enough to sway a policy decision in their favour, they can still make a collective impact on company policies.
Private Company Ownership
We can see that Private Companies own 57%, of the shares on issue. It might be worth looking deeper into this. If related parties, such as insiders, have an interest in one of these private companies, that should be disclosed in the annual report. Private companies may also have a strategic interest in the company.
Next Steps:
While it is well worth considering the different groups that own a company, there are other factors that are even more important. To that end, you should be aware of the 1 warning sign we've spotted with Sinopharm Group .
But ultimately it is the future, not the past, that will determine how well the owners of this business will do. Therefore we think it advisable to take a look at this free report showing whether analysts are predicting a brighter future.
NB: Figures in this article are calculated using data from the last twelve months, which refer to the 12-month period ending on the last date of the month the financial statement is dated. This may not be consistent with full year annual report figures.
Have feedback on this article? Concerned about the content? Get in touch with us directly. Alternatively, email editorial-team (at) simplywallst.com.
This article by Simply Wall St is general in nature. We provide commentary based on historical data and analyst forecasts only using an unbiased methodology and our articles are not intended to be financial advice. It does not constitute a recommendation to buy or sell any stock, and does not take account of your objectives, or your financial situation. We aim to bring you long-term focused analysis driven by fundamental data. Note that our analysis may not factor in the latest price-sensitive company announcements or qualitative material. Simply Wall St has no position in any stocks mentioned.