
V.S. International Group Limited (HKG:1002) shares have had a horrible month, losing 27% after a relatively good period beforehand. Longer-term shareholders would now have taken a real hit with the stock declining 3.0% in the last year.
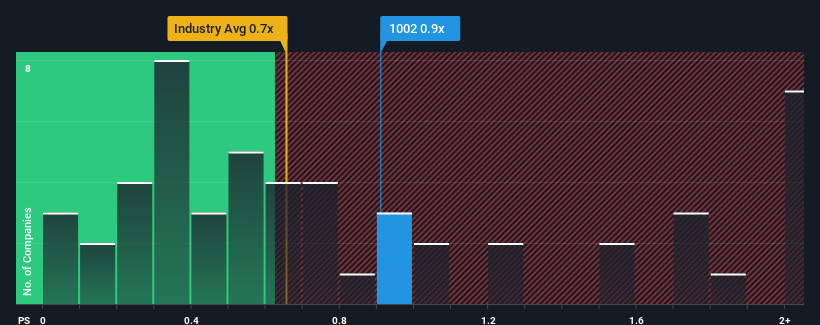
In spite of the heavy fall in price, there still wouldn't be many who think V.S. International Group's price-to-sales (or "P/S") ratio of 0.9x is worth a mention when the median P/S in Hong Kong's Machinery industry is similar at about 0.7x. Although, it's not wise to simply ignore the P/S without explanation as investors may be disregarding a distinct opportunity or a costly mistake.
We've discovered 2 warning signs about V.S. International Group. View them for free.View our latest analysis for V.S. International Group
What Does V.S. International Group's Recent Performance Look Like?
V.S. International Group certainly has been doing a great job lately as it's been growing its revenue at a really rapid pace. It might be that many expect the strong revenue performance to wane, which has kept the share price, and thus the P/S ratio, from rising. If you like the company, you'd be hoping this isn't the case so that you could potentially pick up some stock while it's not quite in favour.
Want the full picture on earnings, revenue and cash flow for the company? Then our free report on V.S. International Group will help you shine a light on its historical performance.How Is V.S. International Group's Revenue Growth Trending?
The only time you'd be comfortable seeing a P/S like V.S. International Group's is when the company's growth is tracking the industry closely.
Taking a look back first, we see that the company grew revenue by an impressive 119% last year. Still, revenue has fallen 16% in total from three years ago, which is quite disappointing. Therefore, it's fair to say the revenue growth recently has been undesirable for the company.
Comparing that to the industry, which is predicted to deliver 14% growth in the next 12 months, the company's downward momentum based on recent medium-term revenue results is a sobering picture.
In light of this, it's somewhat alarming that V.S. International Group's P/S sits in line with the majority of other companies. It seems most investors are ignoring the recent poor growth rate and are hoping for a turnaround in the company's business prospects. There's a good chance existing shareholders are setting themselves up for future disappointment if the P/S falls to levels more in line with the recent negative growth rates.
What We Can Learn From V.S. International Group's P/S?
V.S. International Group's plummeting stock price has brought its P/S back to a similar region as the rest of the industry. Generally, our preference is to limit the use of the price-to-sales ratio to establishing what the market thinks about the overall health of a company.
We find it unexpected that V.S. International Group trades at a P/S ratio that is comparable to the rest of the industry, despite experiencing declining revenues during the medium-term, while the industry as a whole is expected to grow. When we see revenue heading backwards in the context of growing industry forecasts, it'd make sense to expect a possible share price decline on the horizon, sending the moderate P/S lower. If recent medium-term revenue trends continue, it will place shareholders' investments at risk and potential investors in danger of paying an unnecessary premium.
It is also worth noting that we have found 2 warning signs for V.S. International Group that you need to take into consideration.
If you're unsure about the strength of V.S. International Group's business, why not explore our interactive list of stocks with solid business fundamentals for some other companies you may have missed.
Have feedback on this article? Concerned about the content? Get in touch with us directly. Alternatively, email editorial-team (at) simplywallst.com.
This article by Simply Wall St is general in nature. We provide commentary based on historical data and analyst forecasts only using an unbiased methodology and our articles are not intended to be financial advice. It does not constitute a recommendation to buy or sell any stock, and does not take account of your objectives, or your financial situation. We aim to bring you long-term focused analysis driven by fundamental data. Note that our analysis may not factor in the latest price-sensitive company announcements or qualitative material. Simply Wall St has no position in any stocks mentioned.