
Ruifeng Power Group's (HKG:2025) stock is up by a considerable 15% over the past week. However, we decided to pay close attention to its weak financials as we are doubtful that the current momentum will keep up, given the scenario. Particularly, we will be paying attention to Ruifeng Power Group's ROE today.
Return on equity or ROE is an important factor to be considered by a shareholder because it tells them how effectively their capital is being reinvested. Put another way, it reveals the company's success at turning shareholder investments into profits.
We've discovered 1 warning sign about Ruifeng Power Group. View them for free.How Is ROE Calculated?
ROE can be calculated by using the formula:
Return on Equity = Net Profit (from continuing operations) ÷ Shareholders' Equity
So, based on the above formula, the ROE for Ruifeng Power Group is:
1.9% = CN¥19m ÷ CN¥995m (Based on the trailing twelve months to December 2024).
The 'return' is the yearly profit. So, this means that for every HK$1 of its shareholder's investments, the company generates a profit of HK$0.02.
See our latest analysis for Ruifeng Power Group
What Is The Relationship Between ROE And Earnings Growth?
So far, we've learned that ROE is a measure of a company's profitability. Depending on how much of these profits the company reinvests or "retains", and how effectively it does so, we are then able to assess a company’s earnings growth potential. Assuming all else is equal, companies that have both a higher return on equity and higher profit retention are usually the ones that have a higher growth rate when compared to companies that don't have the same features.
Ruifeng Power Group's Earnings Growth And 1.9% ROE
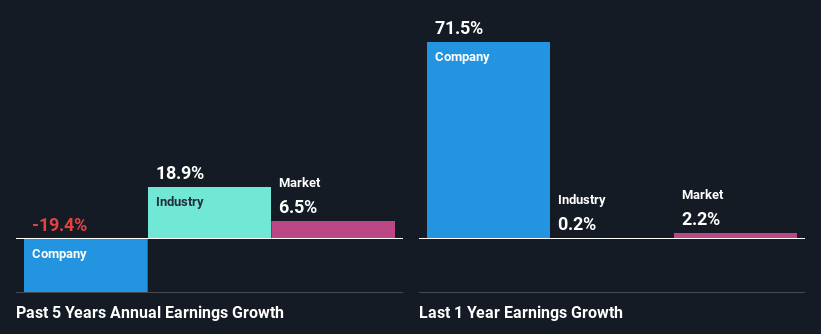
It is quite clear that Ruifeng Power Group's ROE is rather low. Even when compared to the industry average of 5.2%, the ROE figure is pretty disappointing. Therefore, it might not be wrong to say that the five year net income decline of 19% seen by Ruifeng Power Group was possibly a result of it having a lower ROE. However, there could also be other factors causing the earnings to decline. Such as - low earnings retention or poor allocation of capital.
However, when we compared Ruifeng Power Group's growth with the industry we found that while the company's earnings have been shrinking, the industry has seen an earnings growth of 19% in the same period. This is quite worrisome.
Earnings growth is an important metric to consider when valuing a stock. It’s important for an investor to know whether the market has priced in the company's expected earnings growth (or decline). By doing so, they will have an idea if the stock is headed into clear blue waters or if swampy waters await. Is Ruifeng Power Group fairly valued compared to other companies? These 3 valuation measures might help you decide.
Is Ruifeng Power Group Making Efficient Use Of Its Profits?
Ruifeng Power Group's declining earnings is not surprising given how the company is spending most of its profits in paying dividends, judging by its three-year median payout ratio of 64% (or a retention ratio of 36%). The business is only left with a small pool of capital to reinvest - A vicious cycle that doesn't benefit the company in the long-run.
Additionally, Ruifeng Power Group has paid dividends over a period of seven years, which means that the company's management is rather focused on keeping up its dividend payments, regardless of the shrinking earnings.
Summary
Overall, we would be extremely cautious before making any decision on Ruifeng Power Group. Because the company is not reinvesting much into the business, and given the low ROE, it's not surprising to see the lack or absence of growth in its earnings. So far, we've only made a quick discussion around the company's earnings growth. You can do your own research on Ruifeng Power Group and see how it has performed in the past by looking at this FREE detailed graph of past earnings, revenue and cash flows.
Have feedback on this article? Concerned about the content? Get in touch with us directly. Alternatively, email editorial-team (at) simplywallst.com.
This article by Simply Wall St is general in nature. We provide commentary based on historical data and analyst forecasts only using an unbiased methodology and our articles are not intended to be financial advice. It does not constitute a recommendation to buy or sell any stock, and does not take account of your objectives, or your financial situation. We aim to bring you long-term focused analysis driven by fundamental data. Note that our analysis may not factor in the latest price-sensitive company announcements or qualitative material. Simply Wall St has no position in any stocks mentioned.