
Generally speaking long term investing is the way to go. But no-one is immune from buying too high. For example, after five long years the Shandong International Trust Co., Ltd. (HKG:1697) share price is a whole 56% lower. That's an unpleasant experience for long term holders. Furthermore, it's down 13% in about a quarter. That's not much fun for holders. This could be related to the recent financial results - you can catch up on the most recent data by reading our company report.
With the stock having lost 12% in the past week, it's worth taking a look at business performance and seeing if there's any red flags.
There is no denying that markets are sometimes efficient, but prices do not always reflect underlying business performance. One flawed but reasonable way to assess how sentiment around a company has changed is to compare the earnings per share (EPS) with the share price.
Looking back five years, both Shandong International Trust's share price and EPS declined; the latter at a rate of 26% per year. The share price decline of 15% per year isn't as bad as the EPS decline. So investors might expect EPS to bounce back -- or they may have previously foreseen the EPS decline.
You can see below how EPS has changed over time (discover the exact values by clicking on the image).
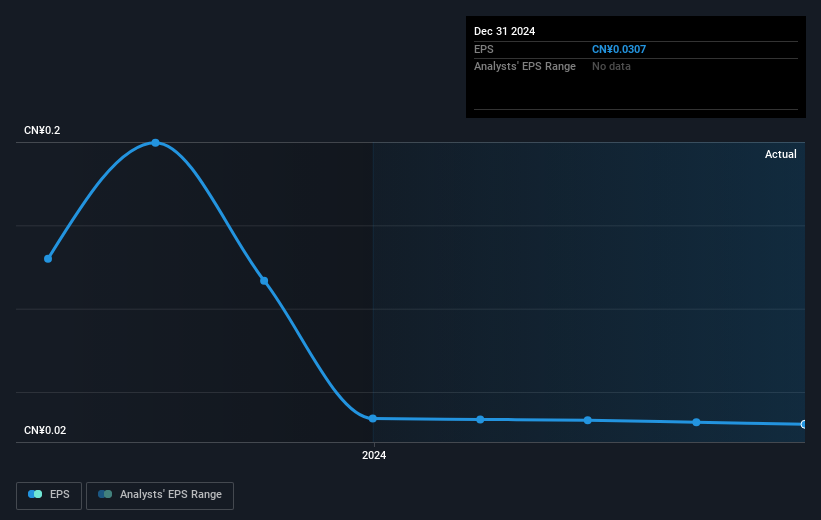
Dive deeper into Shandong International Trust's key metrics by checking this interactive graph of Shandong International Trust's earnings, revenue and cash flow .
What About The Total Shareholder Return (TSR)?
We've already covered Shandong International Trust's share price action, but we should also mention its total shareholder return (TSR). The TSR is a return calculation that accounts for the value of cash dividends (assuming that any dividend received was reinvested) and the calculated value of any discounted capital raisings and spin-offs. Its history of dividend payouts mean that Shandong International Trust's TSR, which was a 52% drop over the last 5 years, was not as bad as the share price return.
A Different Perspective
Shandong International Trust shareholders are up 8.3% for the year. But that return falls short of the market. But at least that's still a gain! Over five years the TSR has been a reduction of 9% per year, over five years. It could well be that the business is stabilizing. I find it very interesting to look at share price over the long term as a proxy for business performance. But to truly gain insight, we need to consider other information, too. Like risks, for instance. Every company has them, and we've spotted 2 warning signs for Shandong International Trust (of which 1 is potentially serious!) you should know about.
Of course Shandong International Trust may not be the best stock to buy. So you may wish to see this free collection of growth stocks.
Please note, the market returns quoted in this article reflect the market weighted average returns of stocks that currently trade on Hong Kong exchanges.
Have feedback on this article? Concerned about the content? Get in touch with us directly. Alternatively, email editorial-team (at) simplywallst.com.
This article by Simply Wall St is general in nature. We provide commentary based on historical data and analyst forecasts only using an unbiased methodology and our articles are not intended to be financial advice. It does not constitute a recommendation to buy or sell any stock, and does not take account of your objectives, or your financial situation. We aim to bring you long-term focused analysis driven by fundamental data. Note that our analysis may not factor in the latest price-sensitive company announcements or qualitative material. Simply Wall St has no position in any stocks mentioned.