
Zhejiang Shibao Company Limited (HKG:1057) shareholders won't be pleased to see that the share price has had a very rough month, dropping 28% and undoing the prior period's positive performance. Looking at the bigger picture, even after this poor month the stock is up 28% in the last year.
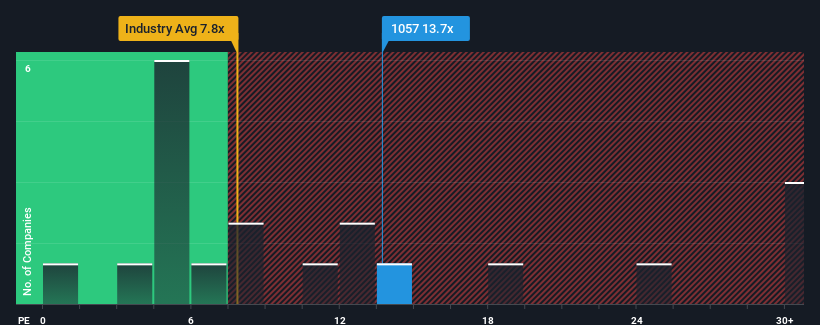
In spite of the heavy fall in price, given around half the companies in Hong Kong have price-to-earnings ratios (or "P/E's") below 9x, you may still consider Zhejiang Shibao as a stock to potentially avoid with its 13.7x P/E ratio. Nonetheless, we'd need to dig a little deeper to determine if there is a rational basis for the elevated P/E.
Recent times have been quite advantageous for Zhejiang Shibao as its earnings have been rising very briskly. The P/E is probably high because investors think this strong earnings growth will be enough to outperform the broader market in the near future. If not, then existing shareholders might be a little nervous about the viability of the share price.
View our latest analysis for Zhejiang Shibao
How Is Zhejiang Shibao's Growth Trending?
Zhejiang Shibao's P/E ratio would be typical for a company that's expected to deliver solid growth, and importantly, perform better than the market.
Retrospectively, the last year delivered an exceptional 87% gain to the company's bottom line. The latest three year period has also seen an excellent 353% overall rise in EPS, aided by its short-term performance. Therefore, it's fair to say the earnings growth recently has been superb for the company.
Weighing that recent medium-term earnings trajectory against the broader market's one-year forecast for expansion of 18% shows it's noticeably more attractive on an annualised basis.
In light of this, it's understandable that Zhejiang Shibao's P/E sits above the majority of other companies. It seems most investors are expecting this strong growth to continue and are willing to pay more for the stock.
The Key Takeaway
Despite the recent share price weakness, Zhejiang Shibao's P/E remains higher than most other companies. Using the price-to-earnings ratio alone to determine if you should sell your stock isn't sensible, however it can be a practical guide to the company's future prospects.
As we suspected, our examination of Zhejiang Shibao revealed its three-year earnings trends are contributing to its high P/E, given they look better than current market expectations. At this stage investors feel the potential for a deterioration in earnings isn't great enough to justify a lower P/E ratio. If recent medium-term earnings trends continue, it's hard to see the share price falling strongly in the near future under these circumstances.
The company's balance sheet is another key area for risk analysis. You can assess many of the main risks through our free balance sheet analysis for Zhejiang Shibao with six simple checks.
Of course, you might also be able to find a better stock than Zhejiang Shibao. So you may wish to see this free collection of other companies that have reasonable P/E ratios and have grown earnings strongly.
Have feedback on this article? Concerned about the content? Get in touch with us directly. Alternatively, email editorial-team (at) simplywallst.com.
This article by Simply Wall St is general in nature. We provide commentary based on historical data and analyst forecasts only using an unbiased methodology and our articles are not intended to be financial advice. It does not constitute a recommendation to buy or sell any stock, and does not take account of your objectives, or your financial situation. We aim to bring you long-term focused analysis driven by fundamental data. Note that our analysis may not factor in the latest price-sensitive company announcements or qualitative material. Simply Wall St has no position in any stocks mentioned.