
Niche-Tech Semiconductor Materials Limited (HKG:8490) shareholders that were waiting for something to happen have been dealt a blow with a 26% share price drop in the last month. The drop over the last 30 days has capped off a tough year for shareholders, with the share price down 15% in that time.
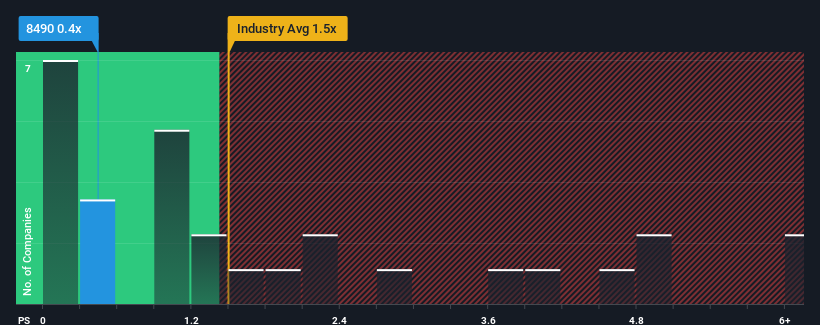
Following the heavy fall in price, Niche-Tech Semiconductor Materials' price-to-sales (or "P/S") ratio of 0.4x might make it look like a buy right now compared to the Semiconductor industry in Hong Kong, where around half of the companies have P/S ratios above 1.5x and even P/S above 5x are quite common. Nonetheless, we'd need to dig a little deeper to determine if there is a rational basis for the reduced P/S.
See our latest analysis for Niche-Tech Semiconductor Materials
How Has Niche-Tech Semiconductor Materials Performed Recently?
For instance, Niche-Tech Semiconductor Materials' receding revenue in recent times would have to be some food for thought. Perhaps the market believes the recent revenue performance isn't good enough to keep up the industry, causing the P/S ratio to suffer. Those who are bullish on Niche-Tech Semiconductor Materials will be hoping that this isn't the case so that they can pick up the stock at a lower valuation.
Want the full picture on earnings, revenue and cash flow for the company? Then our free report on Niche-Tech Semiconductor Materials will help you shine a light on its historical performance.What Are Revenue Growth Metrics Telling Us About The Low P/S?
In order to justify its P/S ratio, Niche-Tech Semiconductor Materials would need to produce sluggish growth that's trailing the industry.
Taking a look back first, the company's revenue growth last year wasn't something to get excited about as it posted a disappointing decline of 8.3%. As a result, revenue from three years ago have also fallen 22% overall. So unfortunately, we have to acknowledge that the company has not done a great job of growing revenue over that time.
Weighing that medium-term revenue trajectory against the broader industry's one-year forecast for expansion of 19% shows it's an unpleasant look.
With this information, we are not surprised that Niche-Tech Semiconductor Materials is trading at a P/S lower than the industry. Nonetheless, there's no guarantee the P/S has reached a floor yet with revenue going in reverse. Even just maintaining these prices could be difficult to achieve as recent revenue trends are already weighing down the shares.
What Does Niche-Tech Semiconductor Materials' P/S Mean For Investors?
The southerly movements of Niche-Tech Semiconductor Materials' shares means its P/S is now sitting at a pretty low level. Typically, we'd caution against reading too much into price-to-sales ratios when settling on investment decisions, though it can reveal plenty about what other market participants think about the company.
As we suspected, our examination of Niche-Tech Semiconductor Materials revealed its shrinking revenue over the medium-term is contributing to its low P/S, given the industry is set to grow. At this stage investors feel the potential for an improvement in revenue isn't great enough to justify a higher P/S ratio. Given the current circumstances, it seems unlikely that the share price will experience any significant movement in either direction in the near future if recent medium-term revenue trends persist.
There are also other vital risk factors to consider and we've discovered 3 warning signs for Niche-Tech Semiconductor Materials (1 is potentially serious!) that you should be aware of before investing here.
If you're unsure about the strength of Niche-Tech Semiconductor Materials' business, why not explore our interactive list of stocks with solid business fundamentals for some other companies you may have missed.
Have feedback on this article? Concerned about the content? Get in touch with us directly. Alternatively, email editorial-team (at) simplywallst.com.
This article by Simply Wall St is general in nature. We provide commentary based on historical data and analyst forecasts only using an unbiased methodology and our articles are not intended to be financial advice. It does not constitute a recommendation to buy or sell any stock, and does not take account of your objectives, or your financial situation. We aim to bring you long-term focused analysis driven by fundamental data. Note that our analysis may not factor in the latest price-sensitive company announcements or qualitative material. Simply Wall St has no position in any stocks mentioned.