
Optima Automobile Group Holdings Limited (HKG:8418) shareholders that were waiting for something to happen have been dealt a blow with a 37% share price drop in the last month. The recent drop completes a disastrous twelve months for shareholders, who are sitting on a 56% loss during that time.
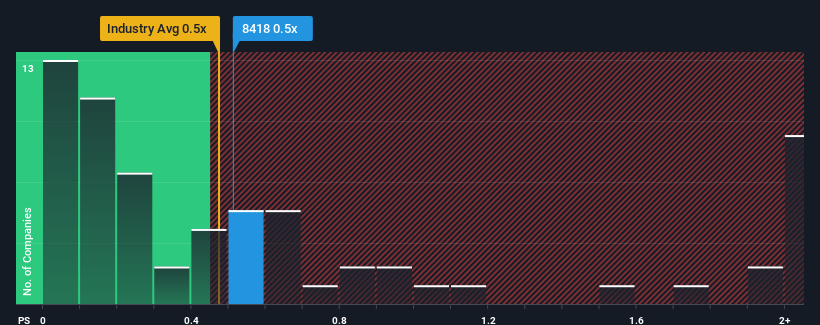
In spite of the heavy fall in price, there still wouldn't be many who think Optima Automobile Group Holdings' price-to-sales (or "P/S") ratio of 0.5x is worth a mention when it essentially matches the median P/S in Hong Kong's Specialty Retail industry. While this might not raise any eyebrows, if the P/S ratio is not justified investors could be missing out on a potential opportunity or ignoring looming disappointment.
Check out our latest analysis for Optima Automobile Group Holdings
How Optima Automobile Group Holdings Has Been Performing
For example, consider that Optima Automobile Group Holdings' financial performance has been poor lately as its revenue has been in decline. It might be that many expect the company to put the disappointing revenue performance behind them over the coming period, which has kept the P/S from falling. If not, then existing shareholders may be a little nervous about the viability of the share price.
We don't have analyst forecasts, but you can see how recent trends are setting up the company for the future by checking out our free report on Optima Automobile Group Holdings' earnings, revenue and cash flow.What Are Revenue Growth Metrics Telling Us About The P/S?
The only time you'd be comfortable seeing a P/S like Optima Automobile Group Holdings' is when the company's growth is tracking the industry closely.
In reviewing the last year of financials, we were disheartened to see the company's revenues fell to the tune of 16%. However, a few very strong years before that means that it was still able to grow revenue by an impressive 54% in total over the last three years. Accordingly, while they would have preferred to keep the run going, shareholders would definitely welcome the medium-term rates of revenue growth.
Comparing the recent medium-term revenue trends against the industry's one-year growth forecast of 32% shows it's noticeably less attractive.
With this in mind, we find it intriguing that Optima Automobile Group Holdings' P/S is comparable to that of its industry peers. It seems most investors are ignoring the fairly limited recent growth rates and are willing to pay up for exposure to the stock. Maintaining these prices will be difficult to achieve as a continuation of recent revenue trends is likely to weigh down the shares eventually.
The Key Takeaway
With its share price dropping off a cliff, the P/S for Optima Automobile Group Holdings looks to be in line with the rest of the Specialty Retail industry. While the price-to-sales ratio shouldn't be the defining factor in whether you buy a stock or not, it's quite a capable barometer of revenue expectations.
We've established that Optima Automobile Group Holdings' average P/S is a bit surprising since its recent three-year growth is lower than the wider industry forecast. When we see weak revenue with slower than industry growth, we suspect the share price is at risk of declining, bringing the P/S back in line with expectations. Unless the recent medium-term conditions improve, it's hard to accept the current share price as fair value.
Don't forget that there may be other risks. For instance, we've identified 2 warning signs for Optima Automobile Group Holdings (1 is a bit unpleasant) you should be aware of.
It's important to make sure you look for a great company, not just the first idea you come across. So if growing profitability aligns with your idea of a great company, take a peek at this free list of interesting companies with strong recent earnings growth (and a low P/E).
Have feedback on this article? Concerned about the content? Get in touch with us directly. Alternatively, email editorial-team (at) simplywallst.com.
This article by Simply Wall St is general in nature. We provide commentary based on historical data and analyst forecasts only using an unbiased methodology and our articles are not intended to be financial advice. It does not constitute a recommendation to buy or sell any stock, and does not take account of your objectives, or your financial situation. We aim to bring you long-term focused analysis driven by fundamental data. Note that our analysis may not factor in the latest price-sensitive company announcements or qualitative material. Simply Wall St has no position in any stocks mentioned.