
Key Insights
- Insiders appear to have a vested interest in Hengan International Group's growth, as seen by their sizeable ownership
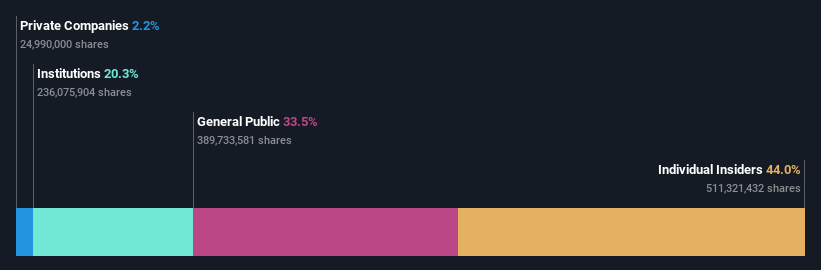
- A total of 4 investors have a majority stake in the company with 52% ownership
- 20% of Hengan International Group is held by Institutions
A look at the shareholders of Hengan International Group Company Limited (HKG:1044) can tell us which group is most powerful. The group holding the most number of shares in the company, around 44% to be precise, is individual insiders. That is, the group stands to benefit the most if the stock rises (or lose the most if there is a downturn).
And following last week's 5.1% decline in share price, insiders suffered the most losses.
Let's delve deeper into each type of owner of Hengan International Group, beginning with the chart below.
See our latest analysis for Hengan International Group
What Does The Institutional Ownership Tell Us About Hengan International Group?
Institutional investors commonly compare their own returns to the returns of a commonly followed index. So they generally do consider buying larger companies that are included in the relevant benchmark index.
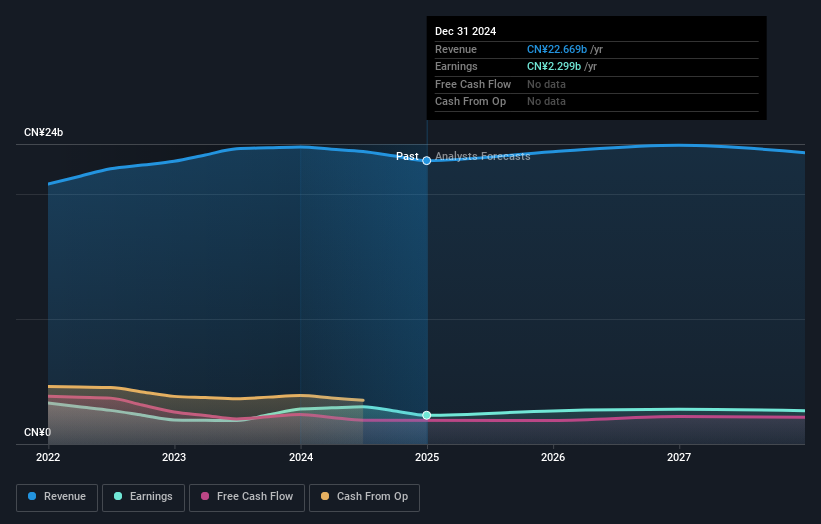
We can see that Hengan International Group does have institutional investors; and they hold a good portion of the company's stock. This implies the analysts working for those institutions have looked at the stock and they like it. But just like anyone else, they could be wrong. If multiple institutions change their view on a stock at the same time, you could see the share price drop fast. It's therefore worth looking at Hengan International Group's earnings history below. Of course, the future is what really matters.
Hengan International Group is not owned by hedge funds. From our data, we infer that the largest shareholder is Lin Chit Hui (who also holds the title of Senior Key Executive) with 23% of shares outstanding. Its usually considered a good sign when insiders own a significant number of shares in the company, and in this case, we're glad to see a company insider play the role of a key stakeholder. Meanwhile, the second and third largest shareholders, hold 21% and 5.6%, of the shares outstanding, respectively. Interestingly, the second-largest shareholder, Man Bok Sze is also Top Key Executive, again, pointing towards strong insider ownership amongst the company's top shareholders.
To make our study more interesting, we found that the top 4 shareholders control more than half of the company which implies that this group has considerable sway over the company's decision-making.
While it makes sense to study institutional ownership data for a company, it also makes sense to study analyst sentiments to know which way the wind is blowing. There are plenty of analysts covering the stock, so it might be worth seeing what they are forecasting, too.
Insider Ownership Of Hengan International Group
The definition of company insiders can be subjective and does vary between jurisdictions. Our data reflects individual insiders, capturing board members at the very least. Management ultimately answers to the board. However, it is not uncommon for managers to be executive board members, especially if they are a founder or the CEO.
I generally consider insider ownership to be a good thing. However, on some occasions it makes it more difficult for other shareholders to hold the board accountable for decisions.
Our most recent data indicates that insiders own a reasonable proportion of Hengan International Group Company Limited. Insiders own HK$11b worth of shares in the HK$25b company. That's quite meaningful. Most would say this shows a good degree of alignment with shareholders, especially in a company of this size. You can click here to see if those insiders have been buying or selling.
General Public Ownership
The general public-- including retail investors -- own 34% stake in the company, and hence can't easily be ignored. While this size of ownership may not be enough to sway a policy decision in their favour, they can still make a collective impact on company policies.
Next Steps:
It's always worth thinking about the different groups who own shares in a company. But to understand Hengan International Group better, we need to consider many other factors. Case in point: We've spotted 1 warning sign for Hengan International Group you should be aware of.
If you are like me, you may want to think about whether this company will grow or shrink. Luckily, you can check this free report showing analyst forecasts for its future.
NB: Figures in this article are calculated using data from the last twelve months, which refer to the 12-month period ending on the last date of the month the financial statement is dated. This may not be consistent with full year annual report figures.
Have feedback on this article? Concerned about the content? Get in touch with us directly. Alternatively, email editorial-team (at) simplywallst.com.
This article by Simply Wall St is general in nature. We provide commentary based on historical data and analyst forecasts only using an unbiased methodology and our articles are not intended to be financial advice. It does not constitute a recommendation to buy or sell any stock, and does not take account of your objectives, or your financial situation. We aim to bring you long-term focused analysis driven by fundamental data. Note that our analysis may not factor in the latest price-sensitive company announcements or qualitative material. Simply Wall St has no position in any stocks mentioned.