
If you're looking for a multi-bagger, there's a few things to keep an eye out for. Typically, we'll want to notice a trend of growing return on capital employed (ROCE) and alongside that, an expanding base of capital employed. This shows us that it's a compounding machine, able to continually reinvest its earnings back into the business and generate higher returns. So on that note, CWT International (HKG:521) looks quite promising in regards to its trends of return on capital.
Return On Capital Employed (ROCE): What Is It?
Just to clarify if you're unsure, ROCE is a metric for evaluating how much pre-tax income (in percentage terms) a company earns on the capital invested in its business. Analysts use this formula to calculate it for CWT International:
Return on Capital Employed = Earnings Before Interest and Tax (EBIT) ÷ (Total Assets - Current Liabilities)
0.044 = HK$342m ÷ (HK$28b - HK$20b) (Based on the trailing twelve months to June 2024).
So, CWT International has an ROCE of 4.4%. Ultimately, that's a low return and it under-performs the Trade Distributors industry average of 5.6%.
View our latest analysis for CWT International
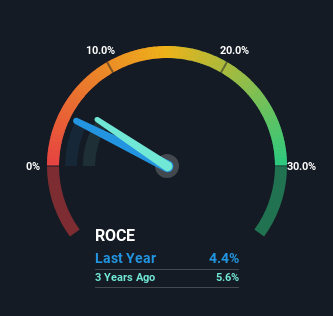
Historical performance is a great place to start when researching a stock so above you can see the gauge for CWT International's ROCE against it's prior returns. If you're interested in investigating CWT International's past further, check out this free graph covering CWT International's past earnings, revenue and cash flow.
So How Is CWT International's ROCE Trending?
Even though ROCE is still low in absolute terms, it's good to see it's heading in the right direction. We found that the returns on capital employed over the last five years have risen by 9,241%. That's not bad because this tells for every dollar invested (capital employed), the company is increasing the amount earned from that dollar. Speaking of capital employed, the company is actually utilizing 21% less than it was five years ago, which can be indicative of a business that's improving its efficiency. If this trend continues, the business might be getting more efficient but it's shrinking in terms of total assets.
On a separate but related note, it's important to know that CWT International has a current liabilities to total assets ratio of 72%, which we'd consider pretty high. This effectively means that suppliers (or short-term creditors) are funding a large portion of the business, so just be aware that this can introduce some elements of risk. While it's not necessarily a bad thing, it can be beneficial if this ratio is lower.
What We Can Learn From CWT International's ROCE
In summary, it's great to see that CWT International has been able to turn things around and earn higher returns on lower amounts of capital. Since the stock has only returned 3.6% to shareholders over the last three years, the promising fundamentals may not be recognized yet by investors. So with that in mind, we think the stock deserves further research.
Since virtually every company faces some risks, it's worth knowing what they are, and we've spotted 3 warning signs for CWT International (of which 1 makes us a bit uncomfortable!) that you should know about.
While CWT International may not currently earn the highest returns, we've compiled a list of companies that currently earn more than 25% return on equity. Check out this free list here.
Have feedback on this article? Concerned about the content? Get in touch with us directly. Alternatively, email editorial-team (at) simplywallst.com.
This article by Simply Wall St is general in nature. We provide commentary based on historical data and analyst forecasts only using an unbiased methodology and our articles are not intended to be financial advice. It does not constitute a recommendation to buy or sell any stock, and does not take account of your objectives, or your financial situation. We aim to bring you long-term focused analysis driven by fundamental data. Note that our analysis may not factor in the latest price-sensitive company announcements or qualitative material. Simply Wall St has no position in any stocks mentioned.