
The Shanghai Chicmax Cosmetic Co., Ltd. (HKG:2145) share price has done very well over the last month, posting an excellent gain of 36%. While recent buyers may be laughing, long-term holders might not be as pleased since the recent gain only brings the stock back to where it started a year ago.
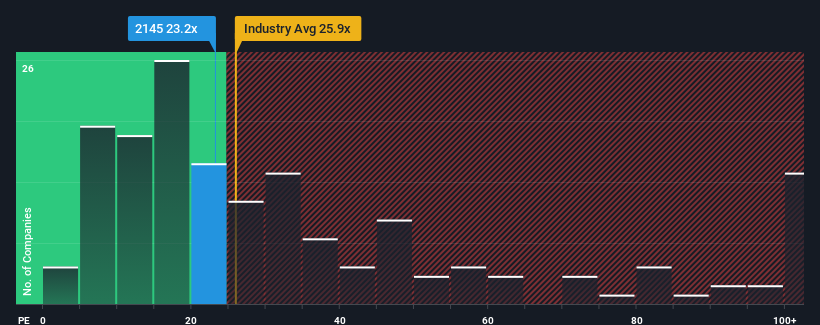
After such a large jump in price, Shanghai Chicmax Cosmetic may be sending very bearish signals at the moment with a price-to-earnings (or "P/E") ratio of 23.2x, since almost half of all companies in Hong Kong have P/E ratios under 10x and even P/E's lower than 6x are not unusual. However, the P/E might be quite high for a reason and it requires further investigation to determine if it's justified.
With earnings growth that's superior to most other companies of late, Shanghai Chicmax Cosmetic has been doing relatively well. It seems that many are expecting the strong earnings performance to persist, which has raised the P/E. You'd really hope so, otherwise you're paying a pretty hefty price for no particular reason.
View our latest analysis for Shanghai Chicmax Cosmetic
How Is Shanghai Chicmax Cosmetic's Growth Trending?
The only time you'd be truly comfortable seeing a P/E as steep as Shanghai Chicmax Cosmetic's is when the company's growth is on track to outshine the market decidedly.
Retrospectively, the last year delivered an exceptional 69% gain to the company's bottom line. The latest three year period has also seen an excellent 108% overall rise in EPS, aided by its short-term performance. Accordingly, shareholders would have probably welcomed those medium-term rates of earnings growth.
Shifting to the future, estimates from the nine analysts covering the company suggest earnings should grow by 21% per year over the next three years. Meanwhile, the rest of the market is forecast to only expand by 12% each year, which is noticeably less attractive.
In light of this, it's understandable that Shanghai Chicmax Cosmetic's P/E sits above the majority of other companies. Apparently shareholders aren't keen to offload something that is potentially eyeing a more prosperous future.
The Final Word
The strong share price surge has got Shanghai Chicmax Cosmetic's P/E rushing to great heights as well. Typically, we'd caution against reading too much into price-to-earnings ratios when settling on investment decisions, though it can reveal plenty about what other market participants think about the company.
As we suspected, our examination of Shanghai Chicmax Cosmetic's analyst forecasts revealed that its superior earnings outlook is contributing to its high P/E. Right now shareholders are comfortable with the P/E as they are quite confident future earnings aren't under threat. It's hard to see the share price falling strongly in the near future under these circumstances.
You should always think about risks. Case in point, we've spotted 1 warning sign for Shanghai Chicmax Cosmetic you should be aware of.
Of course, you might also be able to find a better stock than Shanghai Chicmax Cosmetic. So you may wish to see this free collection of other companies that have reasonable P/E ratios and have grown earnings strongly.
Have feedback on this article? Concerned about the content? Get in touch with us directly. Alternatively, email editorial-team (at) simplywallst.com.
This article by Simply Wall St is general in nature. We provide commentary based on historical data and analyst forecasts only using an unbiased methodology and our articles are not intended to be financial advice. It does not constitute a recommendation to buy or sell any stock, and does not take account of your objectives, or your financial situation. We aim to bring you long-term focused analysis driven by fundamental data. Note that our analysis may not factor in the latest price-sensitive company announcements or qualitative material. Simply Wall St has no position in any stocks mentioned.