
Chuanglian Holdings Limited (HKG:2371) shares have continued their recent momentum with a 32% gain in the last month alone. Looking back a bit further, it's encouraging to see the stock is up 45% in the last year.
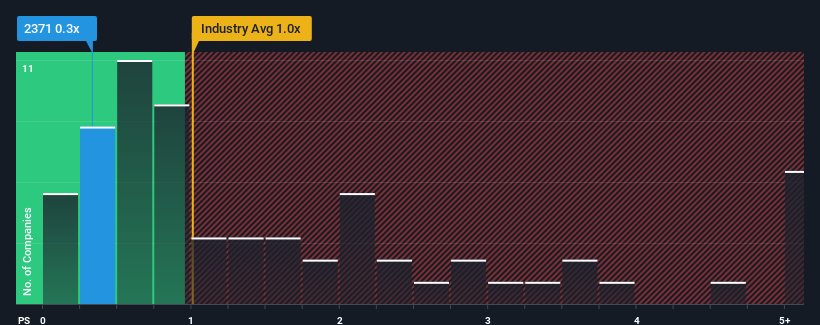
Although its price has surged higher, when close to half the companies operating in Hong Kong's Consumer Services industry have price-to-sales ratios (or "P/S") above 1x, you may still consider Chuanglian Holdings as an enticing stock to check out with its 0.3x P/S ratio. Nonetheless, we'd need to dig a little deeper to determine if there is a rational basis for the reduced P/S.
View our latest analysis for Chuanglian Holdings
How Chuanglian Holdings Has Been Performing
Chuanglian Holdings certainly has been doing a great job lately as it's been growing its revenue at a really rapid pace. It might be that many expect the strong revenue performance to degrade substantially, which has repressed the P/S ratio. If that doesn't eventuate, then existing shareholders have reason to be quite optimistic about the future direction of the share price.
Want the full picture on earnings, revenue and cash flow for the company? Then our free report on Chuanglian Holdings will help you shine a light on its historical performance.Do Revenue Forecasts Match The Low P/S Ratio?
In order to justify its P/S ratio, Chuanglian Holdings would need to produce sluggish growth that's trailing the industry.
Taking a look back first, we see that the company grew revenue by an impressive 49% last year. The strong recent performance means it was also able to grow revenue by 160% in total over the last three years. So we can start by confirming that the company has done a great job of growing revenue over that time.
When compared to the industry's one-year growth forecast of 19%, the most recent medium-term revenue trajectory is noticeably more alluring
With this information, we find it odd that Chuanglian Holdings is trading at a P/S lower than the industry. It looks like most investors are not convinced the company can maintain its recent growth rates.
What Does Chuanglian Holdings' P/S Mean For Investors?
Despite Chuanglian Holdings' share price climbing recently, its P/S still lags most other companies. Using the price-to-sales ratio alone to determine if you should sell your stock isn't sensible, however it can be a practical guide to the company's future prospects.
Our examination of Chuanglian Holdings revealed its three-year revenue trends aren't boosting its P/S anywhere near as much as we would have predicted, given they look better than current industry expectations. When we see strong revenue with faster-than-industry growth, we assume there are some significant underlying risks to the company's ability to make money which is applying downwards pressure on the P/S ratio. At least price risks look to be very low if recent medium-term revenue trends continue, but investors seem to think future revenue could see a lot of volatility.
It's always necessary to consider the ever-present spectre of investment risk. We've identified 3 warning signs with Chuanglian Holdings (at least 1 which can't be ignored), and understanding these should be part of your investment process.
If companies with solid past earnings growth is up your alley, you may wish to see this free collection of other companies with strong earnings growth and low P/E ratios.
Have feedback on this article? Concerned about the content? Get in touch with us directly. Alternatively, email editorial-team (at) simplywallst.com.
This article by Simply Wall St is general in nature. We provide commentary based on historical data and analyst forecasts only using an unbiased methodology and our articles are not intended to be financial advice. It does not constitute a recommendation to buy or sell any stock, and does not take account of your objectives, or your financial situation. We aim to bring you long-term focused analysis driven by fundamental data. Note that our analysis may not factor in the latest price-sensitive company announcements or qualitative material. Simply Wall St has no position in any stocks mentioned.