
Key Insights
- Significant control over China Tianrui Group Cement by private companies implies that the general public has more power to influence management and governance-related decisions
- Tianrui Group Co., Ltd. owns 55% of the company
- Using data from company's past performance alongside ownership research, one can better assess the future performance of a company
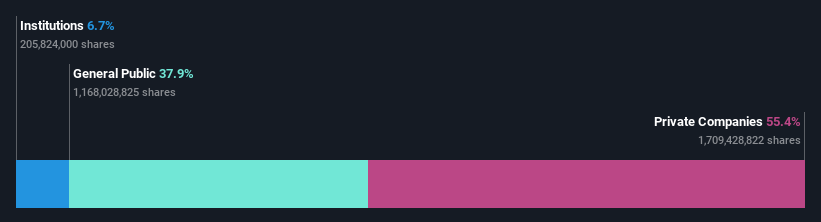
To get a sense of who is truly in control of China Tianrui Group Cement Company Limited (HKG:1252), it is important to understand the ownership structure of the business. We can see that private companies own the lion's share in the company with 55% ownership. That is, the group stands to benefit the most if the stock rises (or lose the most if there is a downturn).
As a result, private companies were the biggest beneficiaries of last week’s 13% gain.
Let's delve deeper into each type of owner of China Tianrui Group Cement, beginning with the chart below.
See our latest analysis for China Tianrui Group Cement
What Does The Institutional Ownership Tell Us About China Tianrui Group Cement?
Institutions typically measure themselves against a benchmark when reporting to their own investors, so they often become more enthusiastic about a stock once it's included in a major index. We would expect most companies to have some institutions on the register, especially if they are growing.
We can see that China Tianrui Group Cement does have institutional investors; and they hold a good portion of the company's stock. This suggests some credibility amongst professional investors. But we can't rely on that fact alone since institutions make bad investments sometimes, just like everyone does. When multiple institutions own a stock, there's always a risk that they are in a 'crowded trade'. When such a trade goes wrong, multiple parties may compete to sell stock fast. This risk is higher in a company without a history of growth. You can see China Tianrui Group Cement's historic earnings and revenue below, but keep in mind there's always more to the story.

China Tianrui Group Cement is not owned by hedge funds. The company's largest shareholder is Tianrui Group Co., Ltd., with ownership of 55%. This essentially means that they have extensive influence, if not outright control, over the future of the corporation. China Cinda Asset Management Co., Ltd., Asset Management Arm is the second largest shareholder owning 6.6% of common stock, and Dimensional Fund Advisors LP holds about 0.03% of the company stock.
Researching institutional ownership is a good way to gauge and filter a stock's expected performance. The same can be achieved by studying analyst sentiments. As far as we can tell there isn't analyst coverage of the company, so it is probably flying under the radar.
Insider Ownership Of China Tianrui Group Cement
The definition of company insiders can be subjective and does vary between jurisdictions. Our data reflects individual insiders, capturing board members at the very least. The company management answer to the board and the latter should represent the interests of shareholders. Notably, sometimes top-level managers are on the board themselves.
Most consider insider ownership a positive because it can indicate the board is well aligned with other shareholders. However, on some occasions too much power is concentrated within this group.
Our data cannot confirm that board members are holding shares personally. It is unusual not to have at least some personal holdings by board members, so our data might be flawed. A good next step would be to take a look at this free summary of insider buying and selling.
General Public Ownership
With a 38% ownership, the general public, mostly comprising of individual investors, have some degree of sway over China Tianrui Group Cement. This size of ownership, while considerable, may not be enough to change company policy if the decision is not in sync with other large shareholders.
Private Company Ownership
Our data indicates that Private Companies hold 55%, of the company's shares. It might be worth looking deeper into this. If related parties, such as insiders, have an interest in one of these private companies, that should be disclosed in the annual report. Private companies may also have a strategic interest in the company.
Next Steps:
It's always worth thinking about the different groups who own shares in a company. But to understand China Tianrui Group Cement better, we need to consider many other factors. For instance, we've identified 3 warning signs for China Tianrui Group Cement (2 make us uncomfortable) that you should be aware of.
Of course this may not be the best stock to buy. Therefore, you may wish to see our free collection of interesting prospects boasting favorable financials.
NB: Figures in this article are calculated using data from the last twelve months, which refer to the 12-month period ending on the last date of the month the financial statement is dated. This may not be consistent with full year annual report figures.
Have feedback on this article? Concerned about the content? Get in touch with us directly. Alternatively, email editorial-team (at) simplywallst.com.
This article by Simply Wall St is general in nature. We provide commentary based on historical data and analyst forecasts only using an unbiased methodology and our articles are not intended to be financial advice. It does not constitute a recommendation to buy or sell any stock, and does not take account of your objectives, or your financial situation. We aim to bring you long-term focused analysis driven by fundamental data. Note that our analysis may not factor in the latest price-sensitive company announcements or qualitative material. Simply Wall St has no position in any stocks mentioned.