
Key Insights
- Huaneng Power International's significant private companies ownership suggests that the key decisions are influenced by shareholders from the larger public
- A total of 3 investors have a majority stake in the company with 51% ownership
- 21% of Huaneng Power International is held by Institutions
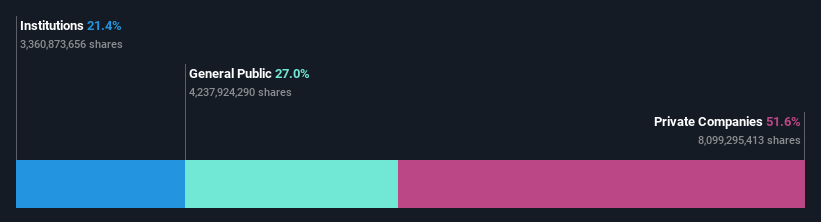
To get a sense of who is truly in control of Huaneng Power International, Inc. (HKG:902), it is important to understand the ownership structure of the business. The group holding the most number of shares in the company, around 52% to be precise, is private companies. Put another way, the group faces the maximum upside potential (or downside risk).
And individual investors on the other hand have a 27% ownership in the company.
In the chart below, we zoom in on the different ownership groups of Huaneng Power International.
View our latest analysis for Huaneng Power International
What Does The Institutional Ownership Tell Us About Huaneng Power International?
Institutions typically measure themselves against a benchmark when reporting to their own investors, so they often become more enthusiastic about a stock once it's included in a major index. We would expect most companies to have some institutions on the register, especially if they are growing.
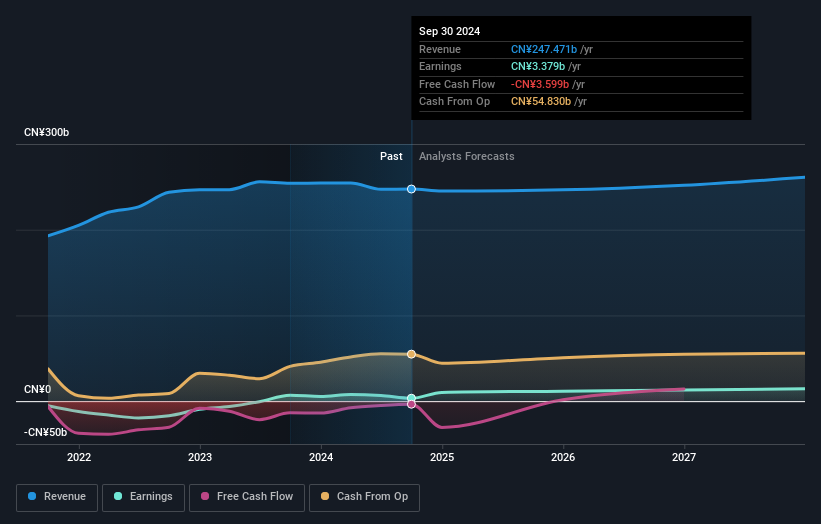
As you can see, institutional investors have a fair amount of stake in Huaneng Power International. This implies the analysts working for those institutions have looked at the stock and they like it. But just like anyone else, they could be wrong. When multiple institutions own a stock, there's always a risk that they are in a 'crowded trade'. When such a trade goes wrong, multiple parties may compete to sell stock fast. This risk is higher in a company without a history of growth. You can see Huaneng Power International's historic earnings and revenue below, but keep in mind there's always more to the story.
Hedge funds don't have many shares in Huaneng Power International. The company's largest shareholder is China Huaneng Group Co., Ltd., with ownership of 45%. The second and third largest shareholders are Wisdomshire Asset Management Co., Ltd. and Hebei Province Construction & Investment Co.,Ltd, with an equal amount of shares to their name at 3.2%.
A more detailed study of the shareholder registry showed us that 3 of the top shareholders have a considerable amount of ownership in the company, via their 51% stake.
While studying institutional ownership for a company can add value to your research, it is also a good practice to research analyst recommendations to get a deeper understand of a stock's expected performance. Quite a few analysts cover the stock, so you could look into forecast growth quite easily.
Insider Ownership Of Huaneng Power International
While the precise definition of an insider can be subjective, almost everyone considers board members to be insiders. The company management answer to the board and the latter should represent the interests of shareholders. Notably, sometimes top-level managers are on the board themselves.
Insider ownership is positive when it signals leadership are thinking like the true owners of the company. However, high insider ownership can also give immense power to a small group within the company. This can be negative in some circumstances.
Our data cannot confirm that board members are holding shares personally. We do not see this low level of ownership often, and it is possible our data is imperfect. But shareholders can click here to check if insiders have been selling stock.
General Public Ownership
The general public-- including retail investors -- own 27% stake in the company, and hence can't easily be ignored. While this group can't necessarily call the shots, it can certainly have a real influence on how the company is run.
Private Company Ownership
We can see that Private Companies own 52%, of the shares on issue. Private companies may be related parties. Sometimes insiders have an interest in a public company through a holding in a private company, rather than in their own capacity as an individual. While it's hard to draw any broad stroke conclusions, it is worth noting as an area for further research.
Next Steps:
While it is well worth considering the different groups that own a company, there are other factors that are even more important. Case in point: We've spotted 4 warning signs for Huaneng Power International you should be aware of, and 2 of them make us uncomfortable.
Ultimately the future is most important. You can access this free report on analyst forecasts for the company.
NB: Figures in this article are calculated using data from the last twelve months, which refer to the 12-month period ending on the last date of the month the financial statement is dated. This may not be consistent with full year annual report figures.
Have feedback on this article? Concerned about the content? Get in touch with us directly. Alternatively, email editorial-team (at) simplywallst.com.
This article by Simply Wall St is general in nature. We provide commentary based on historical data and analyst forecasts only using an unbiased methodology and our articles are not intended to be financial advice. It does not constitute a recommendation to buy or sell any stock, and does not take account of your objectives, or your financial situation. We aim to bring you long-term focused analysis driven by fundamental data. Note that our analysis may not factor in the latest price-sensitive company announcements or qualitative material. Simply Wall St has no position in any stocks mentioned.