
China Oriental Group Company Limited (HKG:581) shareholders would be excited to see that the share price has had a great month, posting a 27% gain and recovering from prior weakness. Looking further back, the 17% rise over the last twelve months isn't too bad notwithstanding the strength over the last 30 days.
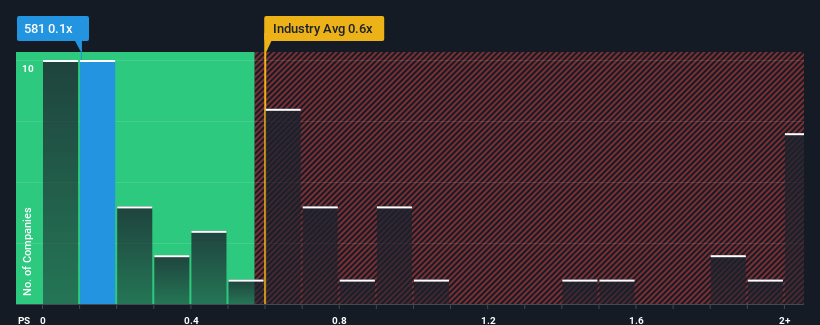
In spite of the firm bounce in price, you could still be forgiven for feeling indifferent about China Oriental Group's P/S ratio of 0.1x, since the median price-to-sales (or "P/S") ratio for the Metals and Mining industry in Hong Kong is also close to 0.6x. While this might not raise any eyebrows, if the P/S ratio is not justified investors could be missing out on a potential opportunity or ignoring looming disappointment.
View our latest analysis for China Oriental Group
How Has China Oriental Group Performed Recently?
It looks like revenue growth has deserted China Oriental Group recently, which is not something to boast about. Perhaps the market believes the recent run-of-the-mill revenue performance isn't enough to outperform the industry, which has kept the P/S muted. If you like the company, you'd be hoping this isn't the case so that you could potentially pick up some stock while it's not quite in favour.
Although there are no analyst estimates available for China Oriental Group, take a look at this free data-rich visualisation to see how the company stacks up on earnings, revenue and cash flow.How Is China Oriental Group's Revenue Growth Trending?
China Oriental Group's P/S ratio would be typical for a company that's only expected to deliver moderate growth, and importantly, perform in line with the industry.
Retrospectively, the last year delivered virtually the same number to the company's top line as the year before. Likewise, not much has changed from three years ago as revenue have been stuck during that whole time. Accordingly, shareholders probably wouldn't have been satisfied with the complete absence of medium-term growth.
In contrast to the company, the rest of the industry is expected to grow by 15% over the next year, which really puts the company's recent medium-term revenue decline into perspective.
With this in mind, we find it worrying that China Oriental Group's P/S exceeds that of its industry peers. It seems most investors are ignoring the recent poor growth rate and are hoping for a turnaround in the company's business prospects. Only the boldest would assume these prices are sustainable as a continuation of recent revenue trends is likely to weigh on the share price eventually.
The Key Takeaway
China Oriental Group's stock has a lot of momentum behind it lately, which has brought its P/S level with the rest of the industry. While the price-to-sales ratio shouldn't be the defining factor in whether you buy a stock or not, it's quite a capable barometer of revenue expectations.
The fact that China Oriental Group currently trades at a P/S on par with the rest of the industry is surprising to us since its recent revenues have been in decline over the medium-term, all while the industry is set to grow. Even though it matches the industry, we're uncomfortable with the current P/S ratio, as this dismal revenue performance is unlikely to support a more positive sentiment for long. If recent medium-term revenue trends continue, it will place shareholders' investments at risk and potential investors in danger of paying an unnecessary premium.
There are also other vital risk factors to consider and we've discovered 3 warning signs for China Oriental Group (2 are a bit concerning!) that you should be aware of before investing here.
Of course, profitable companies with a history of great earnings growth are generally safer bets. So you may wish to see this free collection of other companies that have reasonable P/E ratios and have grown earnings strongly.
Have feedback on this article? Concerned about the content? Get in touch with us directly. Alternatively, email editorial-team (at) simplywallst.com.
This article by Simply Wall St is general in nature. We provide commentary based on historical data and analyst forecasts only using an unbiased methodology and our articles are not intended to be financial advice. It does not constitute a recommendation to buy or sell any stock, and does not take account of your objectives, or your financial situation. We aim to bring you long-term focused analysis driven by fundamental data. Note that our analysis may not factor in the latest price-sensitive company announcements or qualitative material. Simply Wall St has no position in any stocks mentioned.